A lot of video recording devices (dash cams, drones and action cameras such as GoPro) now also record a range of metadata with the video file, such as spatial information that we can use to locate the video and incorporate it into a Geographic Information System, or GIS. In this blog series we’re sharing our progress on using video data captured by a variety of devices within the ArcGIS platform.
In the first blog we looked at an example of how dash cam videos can be imported, shared and used in the ArcGIS platform. We also looked at how video metadata can be extracted and used in an application to extend the capabilities and do more advanced tasks. In the second part of the blog series we looked at how we could use drone videos in the ArcGIS platform.
In this, the third part of the series, we look at how we can use GoPro videos in the ArcGIS platform, covering various functionality that can also be applied to dash cam and drone-acquired video data.
Introduction
GoPro cameras are small, rugged, action cameras designed to be used in harsh conditions. They are capable of capturing high definition video at very high frame rates, alongside GPS and other information, and are primarily targeted at extreme sports participants, to allow them to share their exploits.
In this blog we use as them as a dashcam – but one with higher temporal-resolution GPS data.
Our aim in acquiring a GoPro 8 was to be able to capture our own data for R&D. We had been inspired by presentations at the Esri Dev Summit, such as the session Driving Intelligence from Video and Oriented Imagery at Scale using AI with ArcGIS, and wanted to be able to see what sort of things we could do with video imagery.
Our initial focus was on change detection – potholes frequently develop in our local roads and we thought that trying to spot those and then look back at old data to see if they could be predicted in some way might generate potentially useful results.
Hence, we would have to drive the same route repeatedly. After some brief experimentation, we determined that using the Narrow (27mm) lens option with 1080P (1920 x 1080 pixels) resolution at 24 frames per second would give us best balance of battery life, data volume (11 minutes of 1080P video = 4Gb) and data ‘usability’ – i.e. what we might hope to achieve with the images acquired.
We then set about, as a ‘leisure activity’, driving the same route, over a hill in Shropshire, at the weekend, every few weeks for a year or so. We also drove other routes, to capture a variety of data to support other investigations.
As you’ll see, we’ve not yet made it to the change detection portion of the project, but we thought it worth sharing where we’ve got to so far.
Integrating GoPro data into the ArcGIS platform
After a year or so, we had an unsurprisingly large amount of video data – almost a terabyte, in fact. Our first challenge, as per the previous blogs, was to extract the position information for each of them. Our video processing Add-In, noted in the previous blogs, makes use of the Exif tool, and that, and therefore our Add-In, can be used to process GoPro data. However, there is also a neat online tool called the GoPro Telemetry Extractor which has a free version that allows you to extract position, acceleration and gyroscope data to a variety of formats, including CSV.
Interpolate locations
This time we also wanted to extract the video frames to JPEG images with a point location, so that we could start selecting frames with potholes in for our deep learning potholes project. Having tweaked our Add-In to export each frame to a JPEG, we noted that there were more frames than there were points – for each second of data, we had 24 frames, but ‘only’ 18 GPS locations.
This shouldn’t have been too much of a surprise – the GoPro can capture video at a variety of framerates, so not having a one-to-one correspondence makes sense. Anyway, we had to add some interpolation in to enable our output points featureclass to include one point per frame – a task which involved aligning the movie timestamps and the gps timestamps.
Match frames
Having done all that, we could start looking at the individual video frames in ArcGIS Pro and trying to match them up. Clearly, we weren’t going to get anywhere near perfect frame alignments, as there were a number of variables, only some of which we had reasonable control over:
- The accuracy of the GPS locations captured by the GoPro.
See section below for further discussion. - The position of the GoPro on the vehicle and its orientation relative to the vehicle.
We could mount the GoPro in the same position and orientation for each journey, so this was not an issue to us, but we did, as you will see, determine that having it mounted on the outside of the vehicle improves the positional accuracy for the GPS readings. - The position of the vehicle on the road.
For roads other than motorways or dual carriageways, the vehicle would generally be in the same position on the road.
GPS accuracy
Each GPS position provided by the GoPro has an attribute called “(Dilution of) Precision” associated with it, which is a measure of the quality of the satellite configuration being used to calculate the position and hence is a (partial) measure of the locational accuracy for the point – a larger number means the location is less accurate.
There are, however, many other factors that can affect the locational accuracy, including: proximity to buildings or trees, how long the camera has been operating for, and the fact that it’s on a moving vehicle.
Standing still
To better understand what sort of accuracy we might achieve, we placed the GoPro on a point we could recognize on an accurately-georeferenced orthoairphoto and set it recording.
The map below displays the accuracy of horizontal positioning – the star is the actual location of the GoPro, the greyscale points show the GPS locations recorded, with the lighter tones representing locations with lower ‘dilution of precision’ values, indicating higher precision, than the locations shown in darker tones.
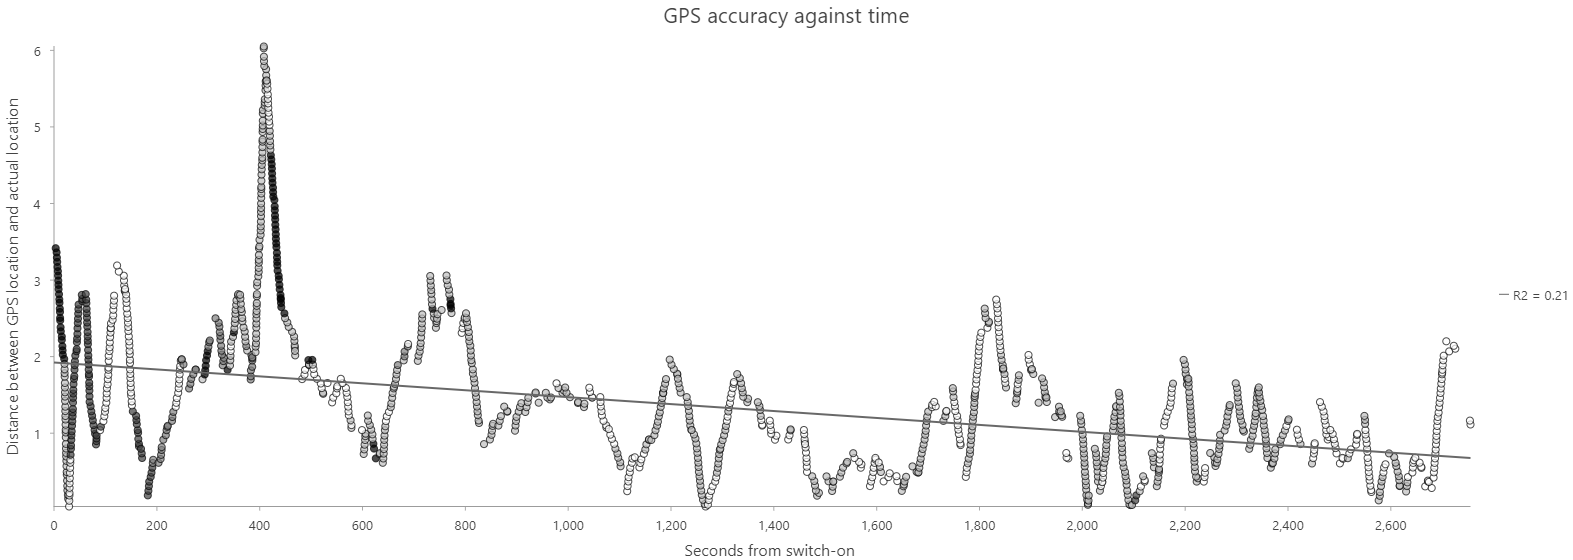
The chart below shows how the horizontal positioning, in this ‘ideal’ scenario, is pretty good to begin with and improves with time, as shown by the trend line, and the increase in precision (dominance of tone shifting from dark to light with time).
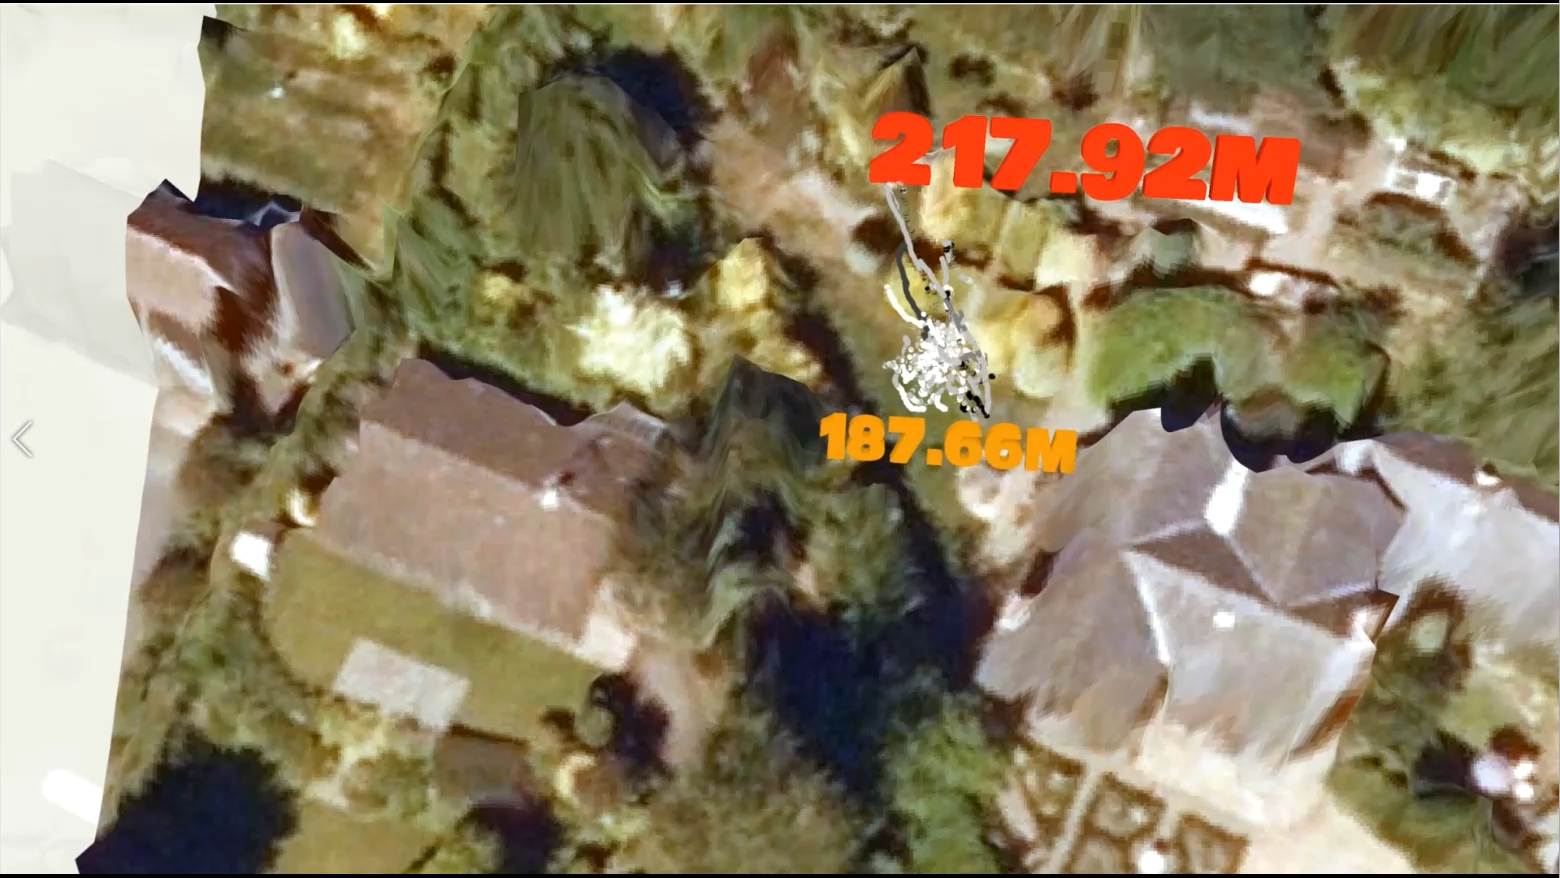
When it comes to the Z dimension, however, things are a bit a different, as illustrated in this video, a still from which is shown below. The actual elevation of the GoPro camera position is c. 196m, but the range of GPS values recorded is from 188 to 218m.
The chart below illustrates the recorded Z values and their relationship to the true value, over time. As with the XY data, the Z accuracy improves with time.
On the move – Inside or outside?
As we’d driven the same route repeatedly, we had a good amount of GPS track data to compare. Unfortunately, we’d mounted the GoPro inside the car for most of the journeys, so we weren’t going to get the highest accuracy from those tracks – we had, however, mounted the camera on the bonnet on a couple of journeys, so we could assess the differences between dashboard (inside) and bonnet (outside) mounts.
Obviously, being shielded from part of the sky by being inside the vehicle reduces the number of satellites that can be acquired, but we thought we’d assess the difference.
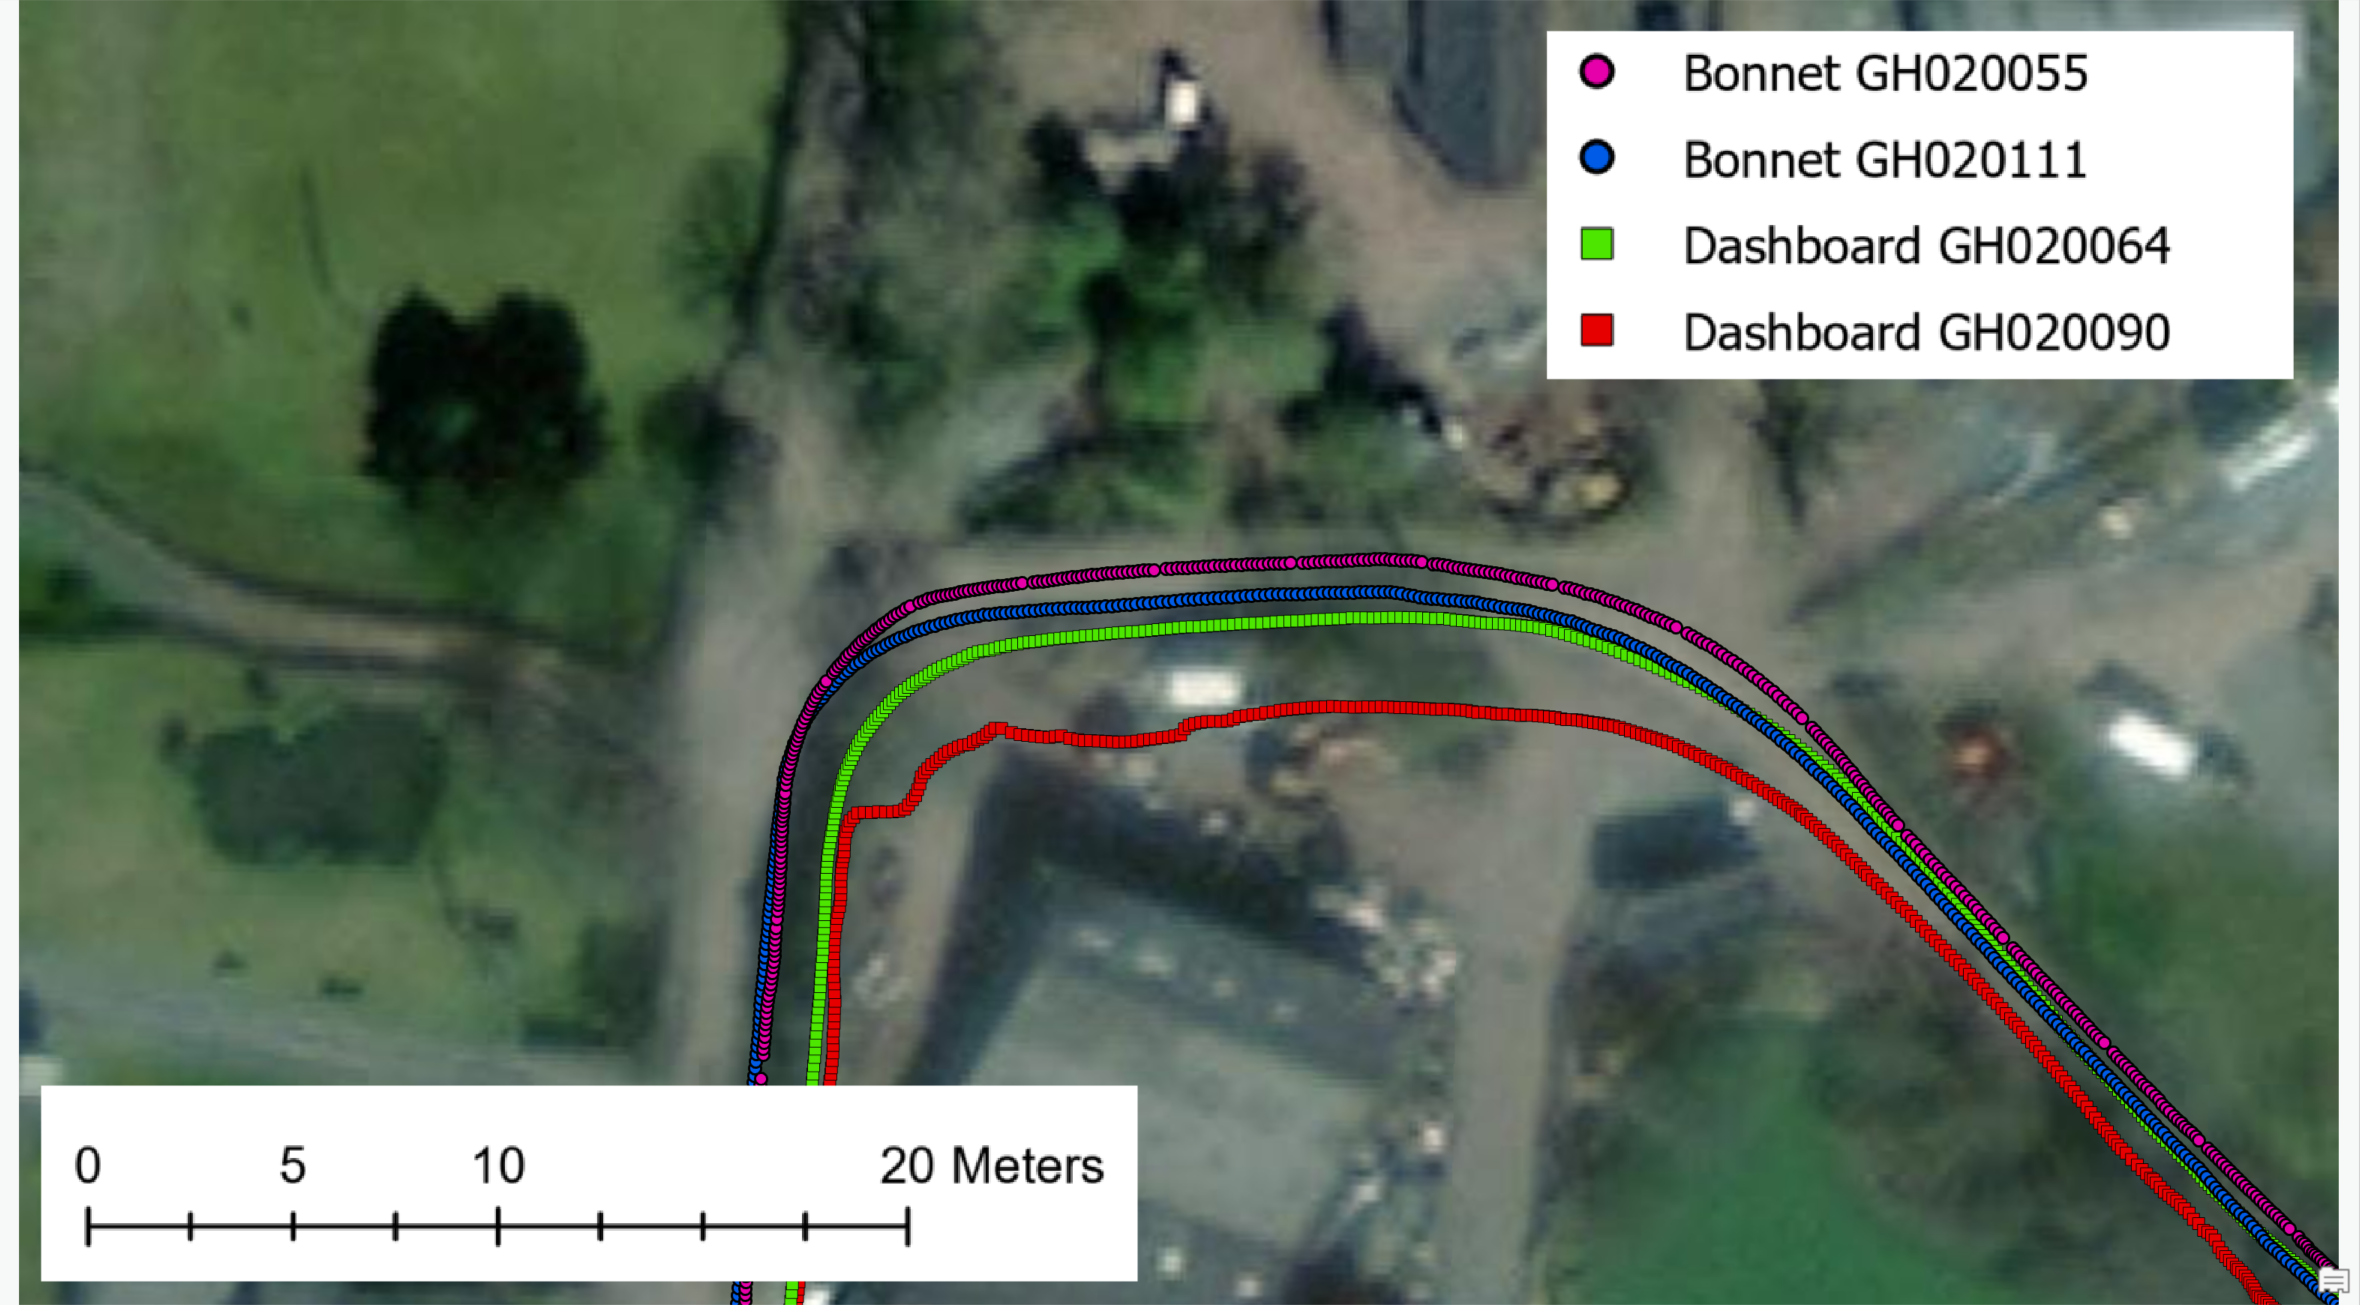
The screenshot below shows a comparison of the locations obtained from two GoPro videos captured from inside the car, and two captured outside it.
The screenshot and this video showing the along track variation illustrate that both the accuracy (its absolute position) and the precision (the relative positions of the same point in different tracks) of the GPS locations are improved by mounting the GoPro on the bonnet rather than the dashboard of the vehicle – it is, however, not perfect – the frames from the individual videos are not precisely located either absolutely (to reality) or relatively (to the frames in other videos).
Note that the accuracy of the locations captured when the GoPro was mounted on the dashboard isn’t awful – although, yes, the precision is clearly lower – and this doesn’t preclude using the locations to match frames.
As an aside, the video and screenshot display the Esri Imagery basemap, and the bonnet-mounted videos appear to have pretty good absolute locations; if you use the Topographic basemap, or the Ordnance Survey OpenMap data, your interpretation of their accuracy may vary – because at these scales we’re running into the limitations of the reference data’s accuracy.
Hyperlink it
So, we have a bunch of points, with varying locational accuracy, representing the frames in multiple videos, and we have the exported JPEG images for each frame (or a selection of the frames, to reduce data volumes – for example, 1 per second).
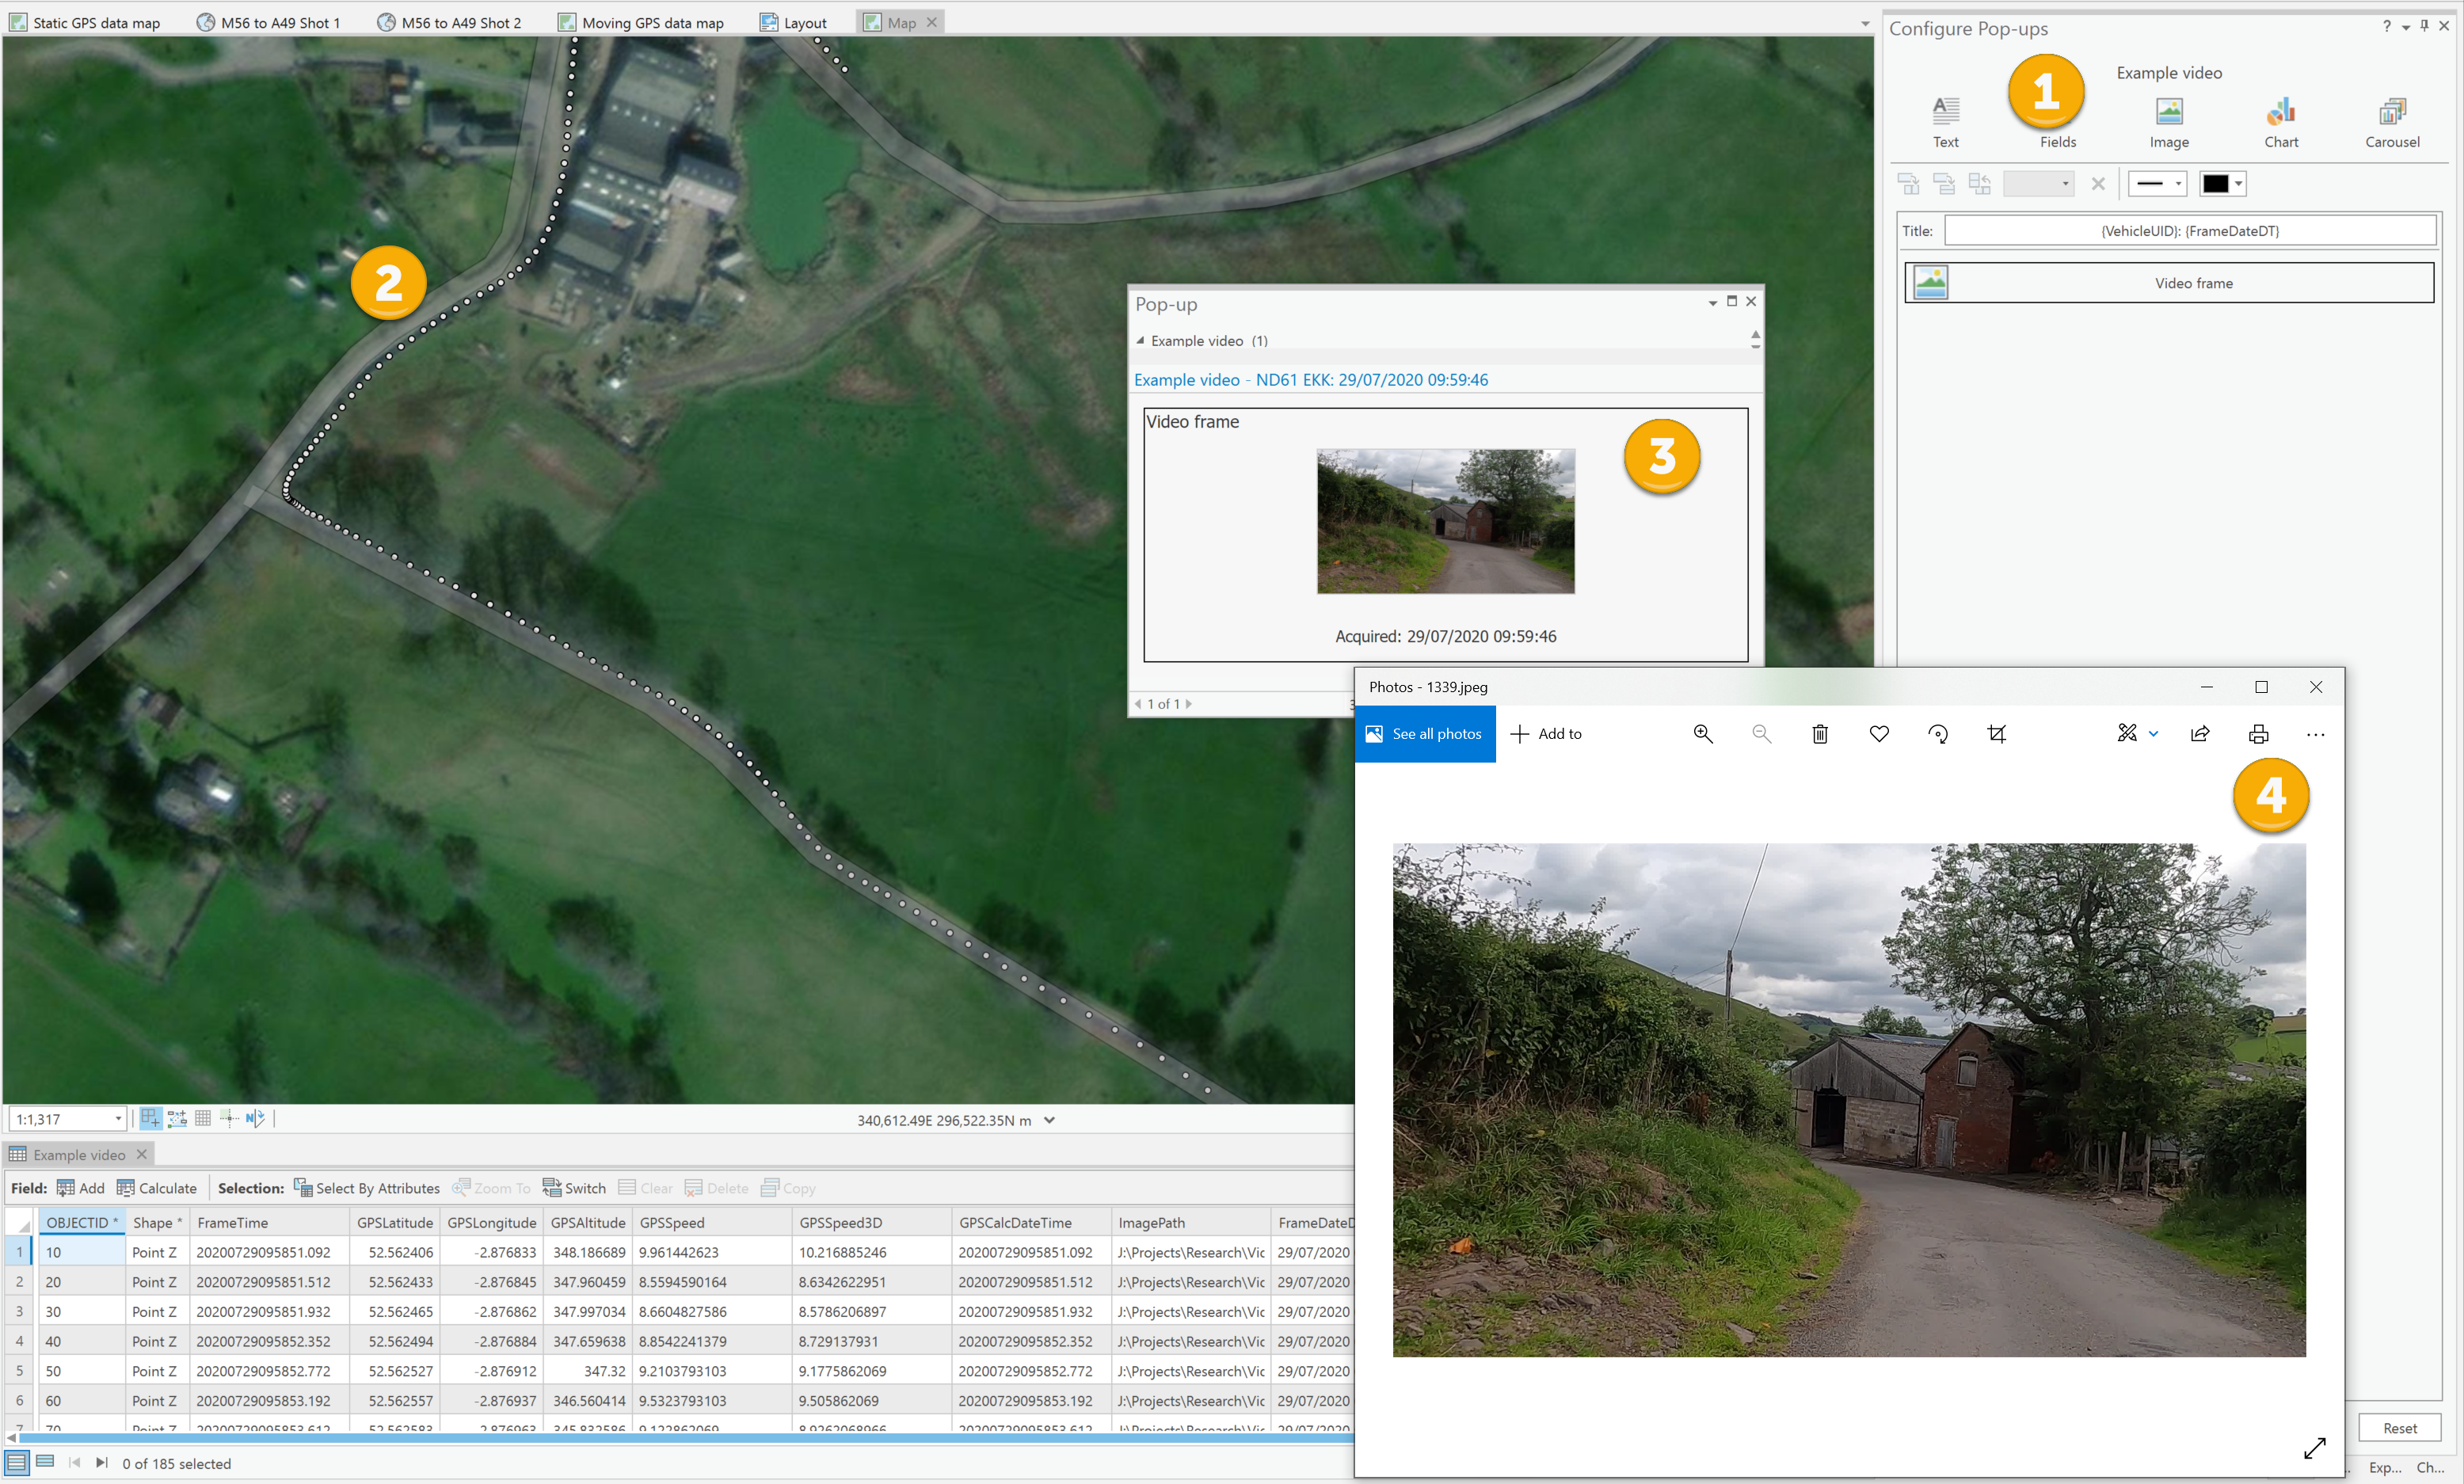
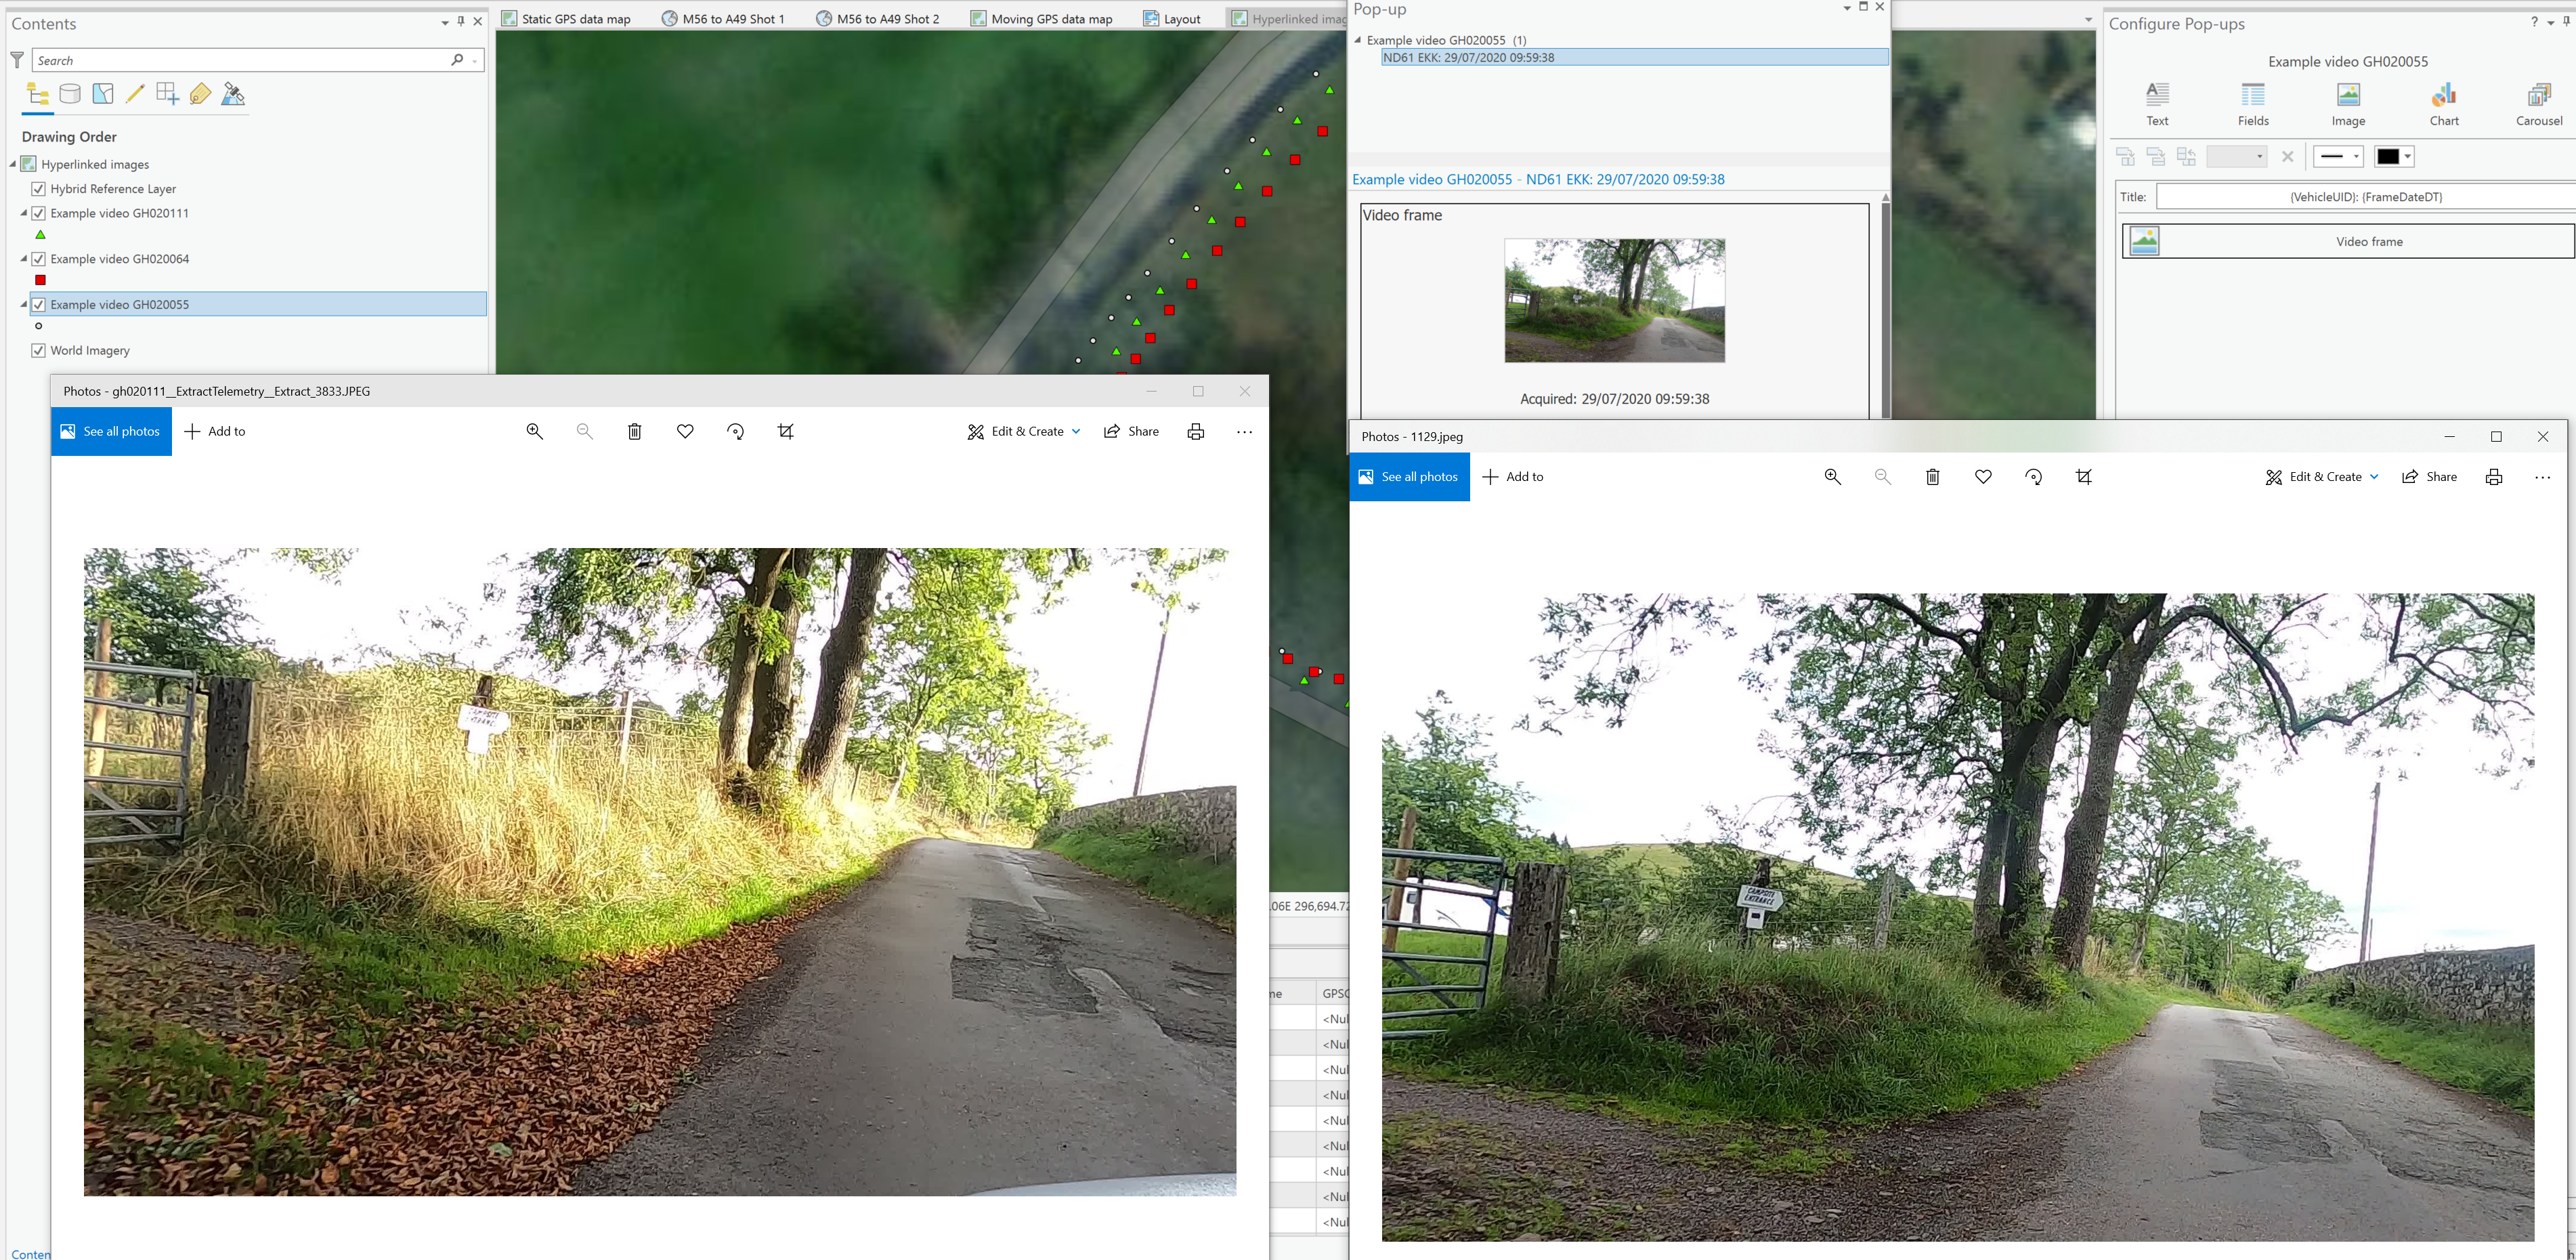
We can use the built-in pop-up functionality in ArcGIS Pro to allow the user to view the frames by executing the workflow described below:
- Use the Configure Pop-ups pane to add an image sourced from the image path field associated with the points featureclass.
The workflow illustrated here has used the image path for both the Source URL and Hyperlink parameters for the image component, meaning that you see a ‘thumbnail’ of the image in the pop-up (item #3) and can click on that to see the full-size version (item #4). - Click on the points at a position of interest to view the pop-ups.
- View the thumbnail.
- Clicking on the thumbnail shows the full-size image.
Repeating this workflow for multiple tracks allows the selection of image pairs for visual comparison, and further study – the screenshot below shows two ‘matching’ frames acquired 14 months apart (the right hand image is from July 2020, the left hand image is from September 2021).
As the example above illustrates, we’ve not quite managed to get our camera orientation the same between journeys, but the images obviously support visual comparison and should support some deep learning to spot those potholes.
Billboard it
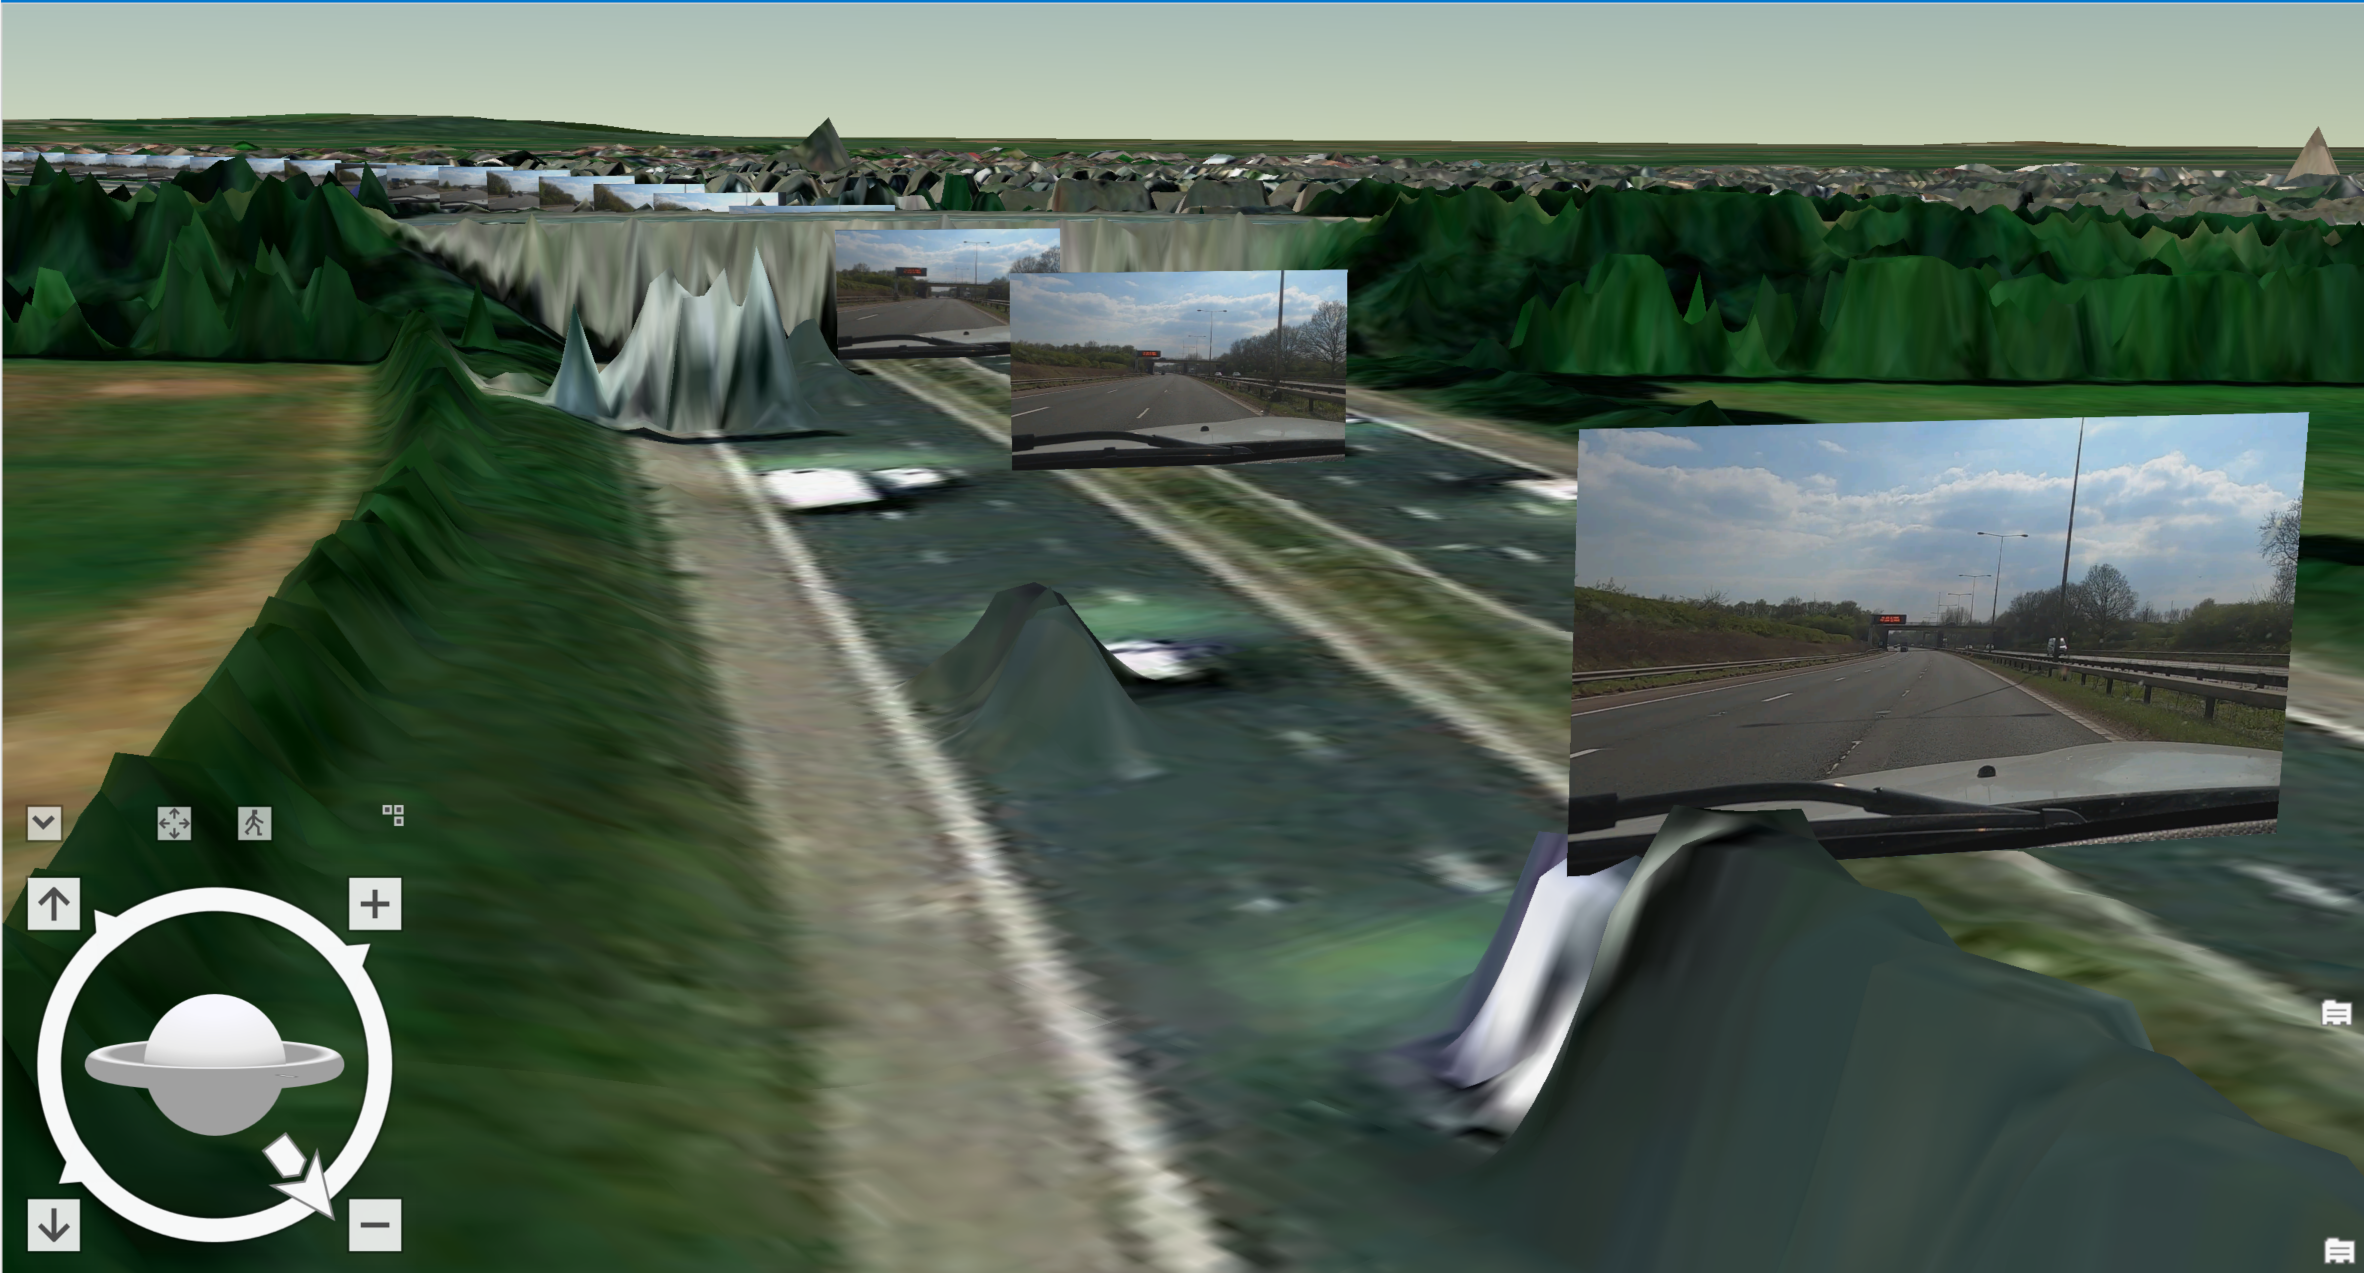
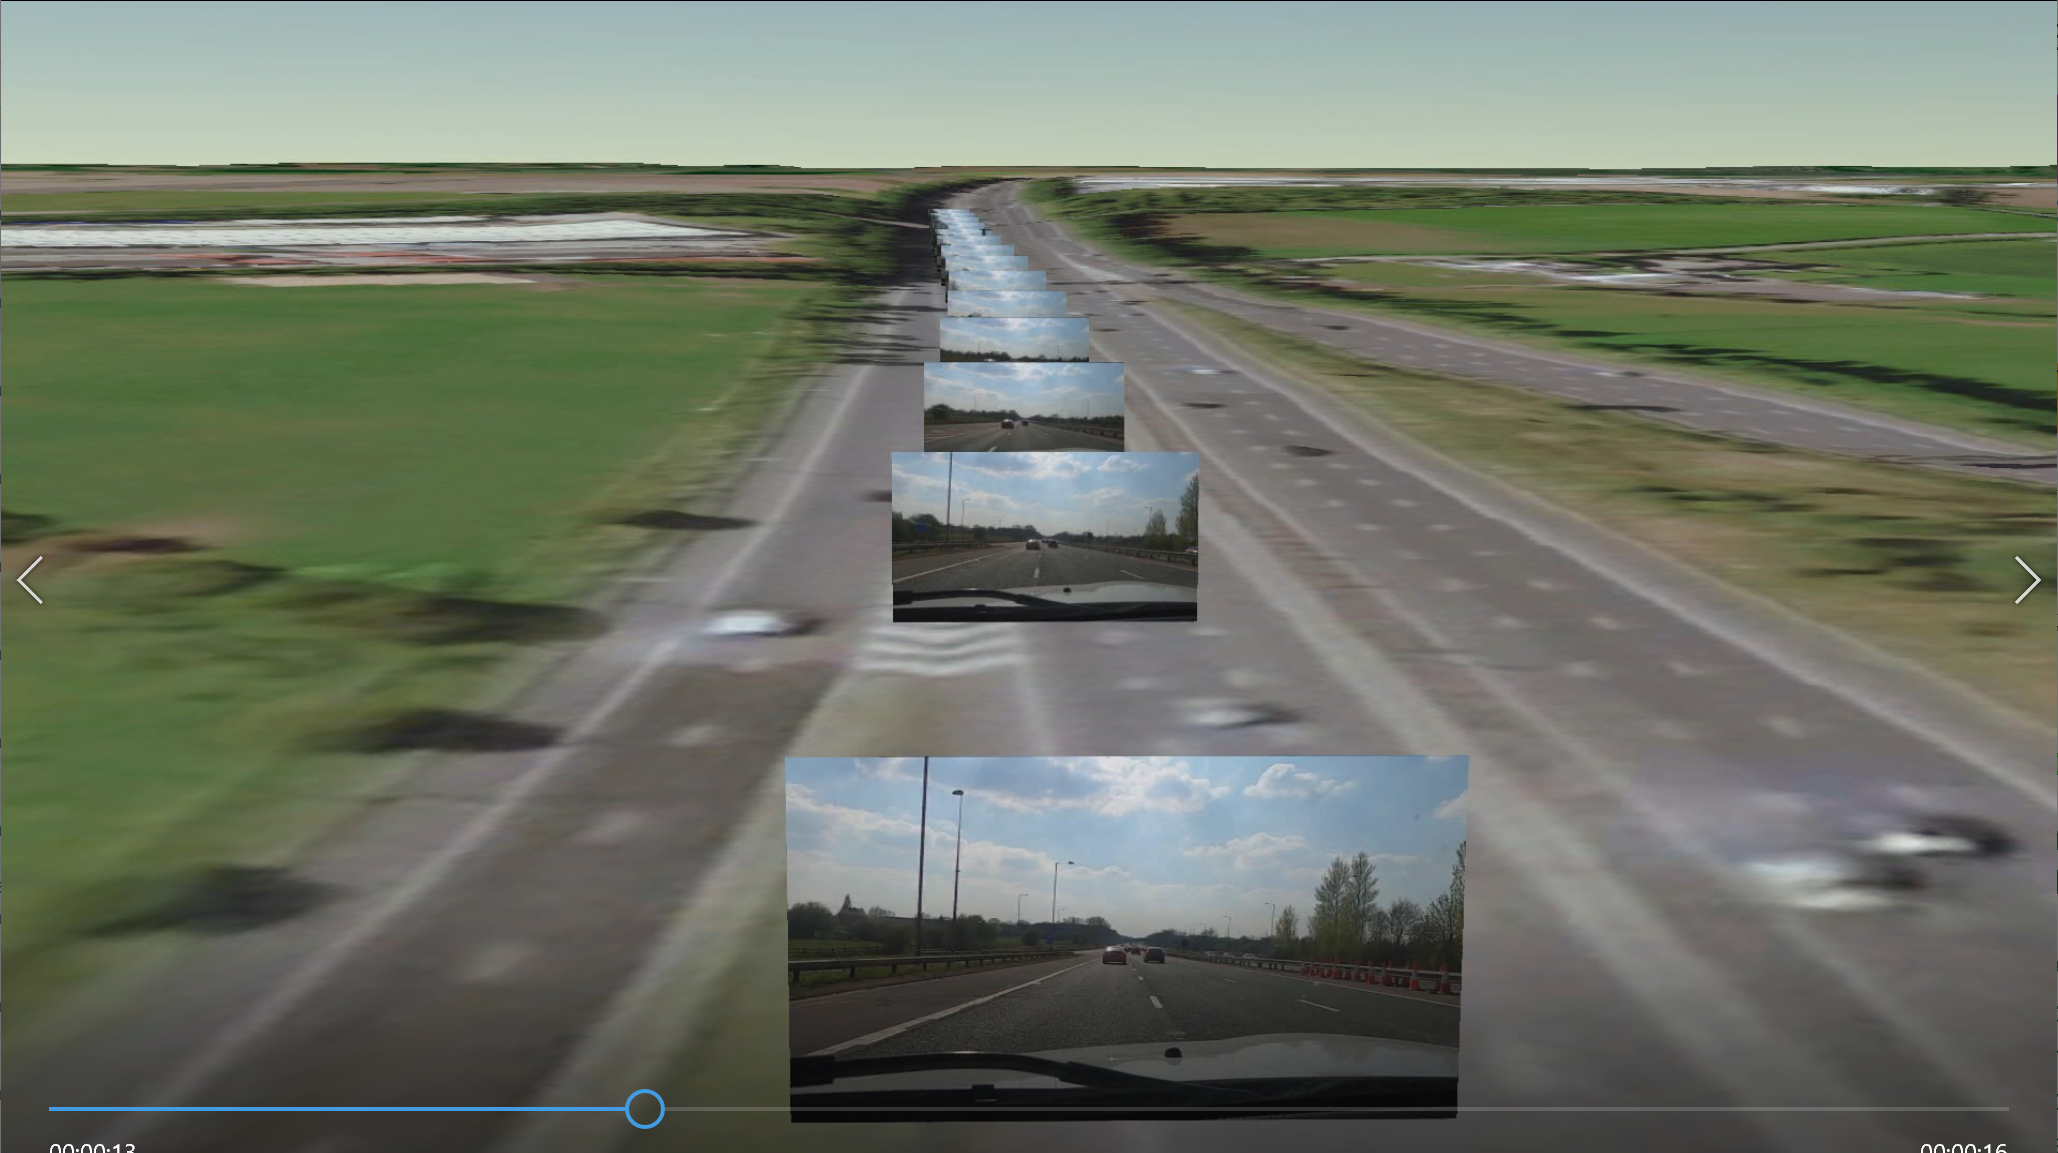
As we like a bit of 3D (who am I kidding – we love it!), an obvious way to visualize the still images was as 3D “billboards”, so we worked out how to do that, borrowing from the work we’d done previously displaying seismic data in our Data Assistant product.
We also worked out how to generate bookmarks to display the billboards full screen in ArcGIS Pro, allowing the videos to be spliced into 3D flythroughs, as shown in the demo video here.
This may seem a fairly niche capability, but we think it opens up some interesting opportunities for merging real and simulated worlds, and the effort supported the extension of our Add-In to generate the Motion Imagery Standards Board (MISB) metadata required by the multiplexing tool in ArcGIS Image Analyst, allowing us to display the video track and watch the video side-by-side in ArcGIS Pro, as shown in this video, a screenshot of which is shown below:
It’s useful to note at this point that the Image Analyst extension does provide featureclass and frame extraction functionality, but crucially it requires the source video to have the MISB metadata available, and this aspect of its extensive functionality focusses on oblique or nadir view aerial imagery.
Conclusion
In this blog post we looked at how we can incorporate GoPro action camera imagery into the ArcGIS Platform, using a combination of out-of-the-box and custom capabilities, and have demonstrated a workflow that supports the easy identification and selection of images from different videos to support multi-temporal analysis and deep learning. We’ll explore those over the coming months, so stay tuned!

