

Exploration Hotspot – Namibia
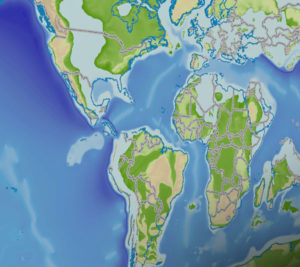
Nothing focuses global industry attention like concentrated exploration success. The month of February 2022 saw back-to-back announcements of discoveries in Namibia with Shell declaring at least 60 m of light-oil pay at Graff-1 on Exploration License PEL-39 in the first week of the month, and Total’s Venus-1x upping the ante with 84 m of high-quality, light-oil sandstone reservoir on PEL-56 in the last week of the month (Figure 1).
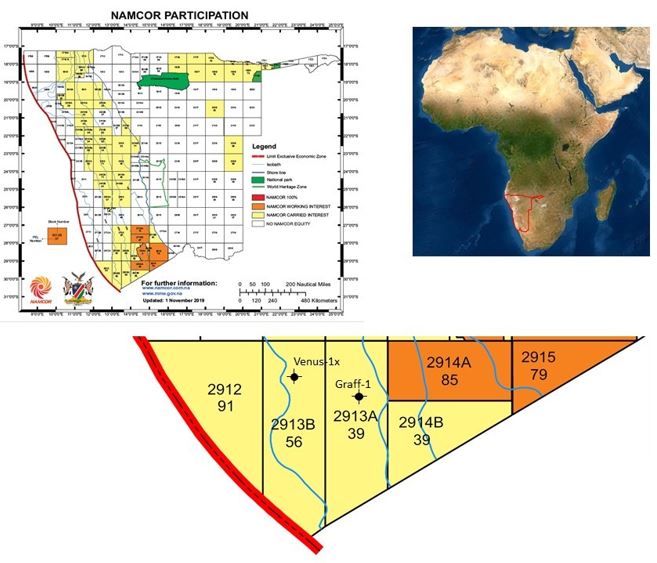
Figure 1 – Location of Discoveries Venus-1x (PEL56) and Graff-1 (PEL39) offshore Namibia.
Base map from NAMCOR, well locations from Global Petroleum Ltd.
Both wells proved an oil-mature source, in contrast to gas found in the two nearest commercial fields, Namibia’s Kudu Field and South Africa’s Ihubesi Field. The more lucrative commodity will be needed to support development hundreds of kilometers offshore, in 2000 to 3000 m water depths.
Venus appears to have tapped a slightly deeper and older target, with total depth of 6,296 m in something less than 3,000 m of water, compared to Graff’s TD of 5,376 m at something more than 2,000 m water depth. Total announced the reservoir at Venus is Lower Cretaceous; Global Petroleum speculates more precisely that the Venus reservoirs are Aptian, whereas the Graff reservoirs may be Aptian to Lower Albian.
As IHS analysts remark, Venus marks a continuation of Total’s high-risk/high-reward quest for deep water prospects in frontier plays, including the world-water-depth-record setting well Ondjaba-1 on the Congo Fan, and the successful Brulpadda and Luiperd wells around the continental corner in South Africa’s Outeniqua Basin.
Exploring the Frontier Requires Palaeoenvironmental Context
The Namibian exploration hotspot emphasizes the importance of fundamental geologic knowledge when exploring far from well control both along the margin and away from the coastline. However good the seismic data may be, frontier explorers must speculate about depositional environments, reservoir or source presence and quality, burial history, and thermal maturity without direct confirming evidence. Those speculations have a greater chance at accuracy the more firmly grounded they are in the geologic history of the region. This article draws attention to some of the primal palaeo-geographic, -climatic, and -oceanographic datasets that support effective exploration on the frontier, in Namibia or elsewhere.
Distribution of the Continents
The first requirement is to know the proper distribution of the continents and oceans, and associated topography and bathymetry. Latitude is the first-order control on the amount of sunlight to drive photosynthesis for primary organic productivity, for gross atmospheric and oceanographic circulation, and for the level and seasonality of temperature and precipitation. The width of oceanic gateways between the continents, the height of the mountains, and the depths of the oceans influence global circulation patterns. Figure 2 represents the position of the plates and the associated geography of the Albian, near the middle of the Cretaceous.
These plate tectonic reconstructions rest upon detailed structural (e.g., Salem & Mohammed, 2015; Cheyney et al., 2016; Cascone et al., 2017) and crustal-architecture (Salem et al. 2014a,b) interpretation of Getech’s extensive gravity and magnetic databases. Crustal architecture includes plate boundaries, and intraplate variations in thickness, lithology, and kinematic history derived from inversion of gravity and magnetic data and from literature interpretations (e.g. Guy et al., 2014; Ali et al., 2017; Drachev et al., 2018a,b). Plate boundaries and plate-motion indicators including oceanic fracture patterns, magnetic picks, paleomagnetic orientation data, and geologic feature correlation provide the constraints for Getech’s bespoke plate models (e.g. Fairhead et al., 2013; Liu et al., 2014; Sagi et al., 2015, 2016).
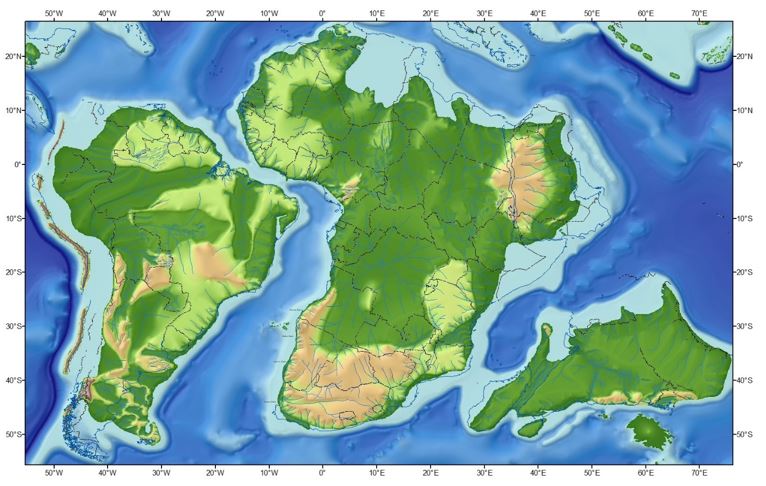
Figure 2 – Albian Palaeogeography. Getech Plate Model 4.1, snapshot at 106.75 Ma.
Tectonophysiography and Palaeoenvironments
The shape of the Earth’s surface (topography and bathymetry), and the sediment-delivery and depositional systems that operate on the Earth’s surface, are driven by the ceaseless interplay between uplift and erosion. The first step to quantifying the rates and magnitude of the processes, and then the topographic and bathymetric consequences, is to identify tectonophysiographic terranes. These are distinguished by their tectonic setting and characteristics of the crust, like thickness and lithology, and the mechanism and timing of vertical uplift. Figure 3 illustrates the distribution of erosional and depositional areas of Africa and surrounding continents in the Albian. Figure 4 explains the meaning of the symbology. The erosional areas are assigned colors according to the driving mechanism that makes them high and receive hatching that indicates whether the mechanism is active (no hatching) or relict, with progressively broader hatching representing a longer period of inactivity. The depositional areas are distinguished by their position above or below sea level; the bathymetric category is a function of the thickness and age of the crust.
Tectonophysiographic terranes (TPT) that have consistent tectonic histories are identified from crustal architecture and attributed according to the timing and mechanism of vertical motions (e.g., Fairhead et al., 2011; Wilson, 2012; Vincent et al., 2016). Depocenters and gross depositional environments are identified directly from geophysics (Cheyney et al., 2015) and indirectly from tectonic histories constrained by geological evidence of uplift, erosion, and deposition (e.g., Campbell et al., 2012; Sutcliff and Malan, 2017; Stewart et al., 2018).
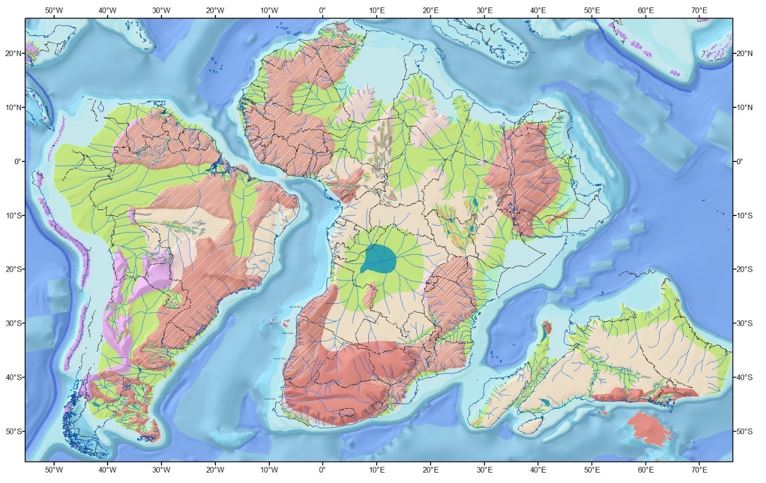
Figure 3 – Albian Tectonophysiographic terranes and palaeoenvironments.
Getech Plate Model 4.1, snapshot at 106.75 Ma.
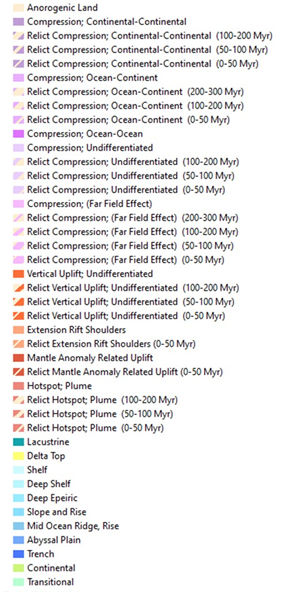
Figure 4 – Legend for tectonophysiographic terranes and palaeoenvironments.
Quantitative Topography and Bathymetry
With the crustal architecture and driving mechanisms identified, it is possible to model uplift and erosion quantitatively in highlands, and to model subsidence quantitatively in basins; in the oceans the depth to the sea floor is a function of the age and thickness of the oceanic crust. With additional constraints from the position of rivers, inferred from geomorphology and fluvial deposits, and from depositional patterns and thicknesses, quantitative topographic and bathymetric grids can be computed. Figure 5 shows the relevant topographic and bathymetric result for the Albian of Nambia, with spot heights and depths posted on the map to demonstrate that this is a quantitative, rather than an artistic, representation of the Earth’s surface.
Palaeodrainage systems are mapped starting with Present Day networks and tracking evolution back through time using geomorphic, sedimentologic, and paleocurrent evidence (e.g., Markwick et al., 2012; Bonne, 2014; Wareham et al., 2016). Detailed topography and bathymetry are inferred from thermal modelling of tectonic forcing on crustal buoyancy due to thickness, lithology, and temperature history, constrained by modern analogues (Stein and Stein, 1992; Markwick and Valdes, 2004).
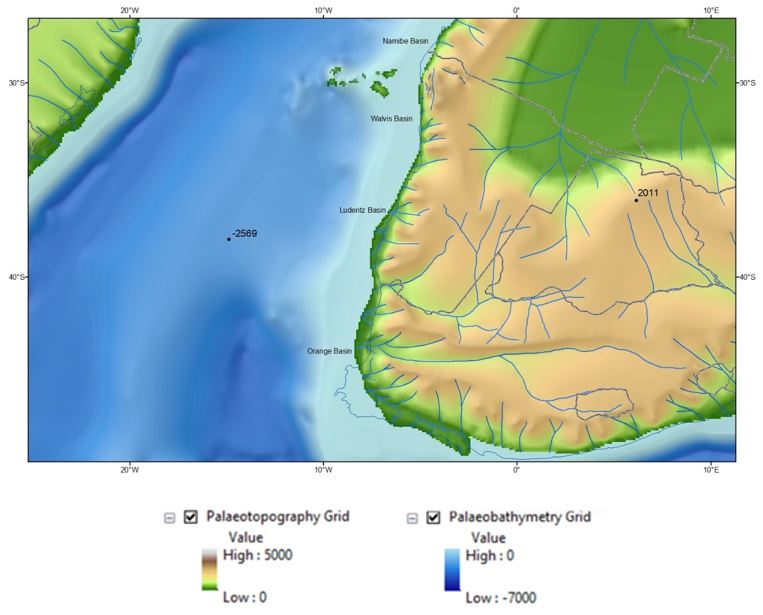
Figure 5 – Albian Palaeotopography and bathymetry, with spot elevations/depths in m.
Palaeogeology
Inferences about the volume, grain size, and mineralogy of sediment derived from the continents depends more than anything else on the raw materials from which the sediments were derived (Heins & Kairo, 2007). It is possible to reconstruct palaeosurface geology from today’s geologic map, by removing rocks younger than the interval of interest, restoring older rocks subsequently removed by erosion, and undoing tectonic deformation. The result is a map like Figure 6.
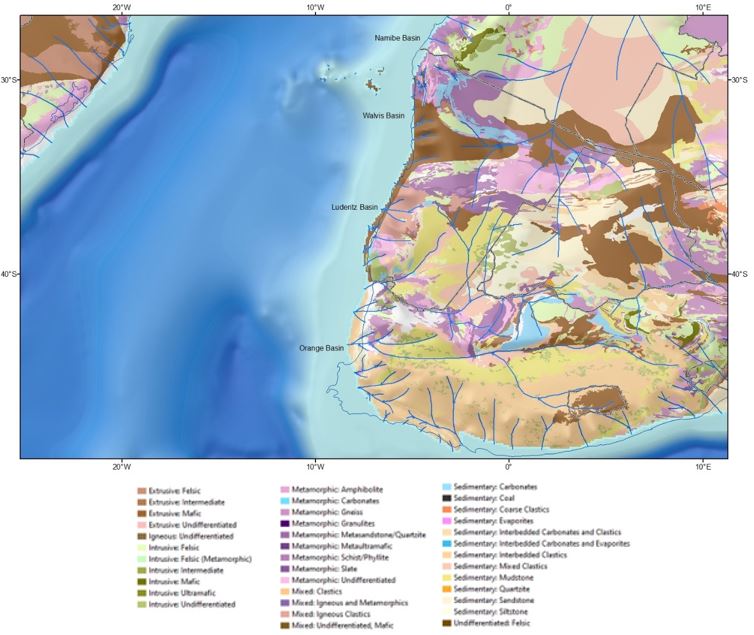
Figure 6 – Albian palaeosurface geology
Palaeoclimate and Palaeoceanography
The palaeogeographic reconstructions are used as boundary conditions for General Circulation Model-based paleoclimate and paleoceanographic reconstructions, and physics-based tidal modelling to document the environmental conditions prevailing in the past (e.g., Wells et al., 2010; Herold et al., 2014; Inglis et al., 2015; Armstrong et al., 2016; Tabor et al., 2016; Lunt et al., 2017; Niezgodzki et al., 2017; Robinson et al., 2017; Farnsworth et al., 2019; Harland et al., 2019).
Outputs from the environmental modelling include: climate variables like air temperature at the surface and 1.5m, wind speed and direction at 10 m, precipitation, evaporation, runoff (fast, slow, and total), and eddy kinetic energy (to name a few); oceanographic variables like water temperature, salinity, current speed and direction, upwelling and mixed layer depth; tidal variables like range, amplitude, and bed shear stress. The climate variables are resolved monthly. The oceanographic variables are resolved seasonally, but at a variety of depths. The tidal values are mean annual.
Thermal Boundary Conditions
Burial thermal history is typically modelled with sophisticated computational tools based on thermodynamic principles. These models require some boundary-condition input to properly calculate the appropriate PTt evolution of a well or a basin. Useful maps include basement heat production and surface heat flow, which can be estimated from the same crustal architecture elements that go into mapping tectonophysiographic terranes, as in Figure 7 for example. In this case, the conditions are represented for the present day. Maps exist for the sediment-water interface temperature at every geologic stage; it is more convenient for thermal modelling at a well location to extract the value at a point from each map, for import into a formal modelling package, as in Figure 8.
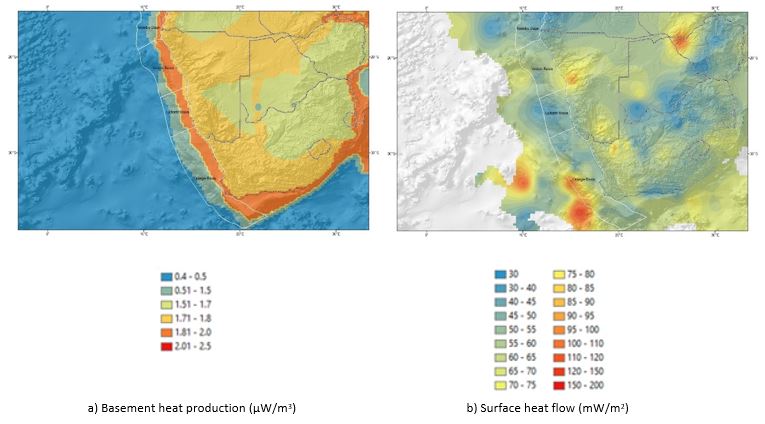
Figure 7 – Thermal boundary conditions at the base of the sedimentary column
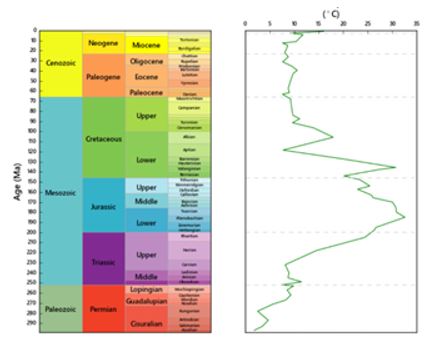
Figure 8 – Sediment-water interface temperature, at the top of the sedimentary column, extracted from General Circulation Model calculations in the vicinity of Venus-1 and Graff-1 for each stage of geologic time.
Conclusion – Using Palaeoenvironmental Context to Evaluate Exploration Risk
Out at the far edge of explored territory, where Venus-1 and Graff-1 sit for example, the nearest logs or core samples are many 10s to 100s of km away. Wells like Venus-1 and Graff-1 give vital information to de-risk exploration, but the gaps between observations are still enormous. Inferences about the precise meaning of different seismic geometries or seismic attributes must be evaluated against physical properties that come from distant analogues or are simply assumed. The best way to select appropriate analogues, or to evaluate play elements, is to compare the genetic conditions operating where the observations are confident, with the genetic conditions in operation where the desired parameters are speculative.
Reservoir Example
One example is using the Sand Generation and Evolution model of Heins & Kairo (2007) to make quantitative predictions of sand caliber and mineralogy at deposition, which are combined with burial thermal history in a reservoir quality forward model like Touchstone (Lander et al. 2008) to arrive at a reasonable expectation of porosity and permeability at an uncalibrated site (Figure 9). In cases where no nearby analogue for the original sand composition and texture is available, it is possible to predict what the original sand should look like by considering the palaeoenvironmental conditions at the time the sand was generated, transported, and delivered (Figure 10). The character of the sand depends on the raw materials (provenance lithotypes) from which the sediment is made, the duration and intensity of physical and chemical processes that operate on the sediment during transport across the hinterland, and the hydrodynamic segregation of material into different environments of deposition within the basin.
Source Example
Getech use a similar method to evaluate the complex interaction of multiple environmental conditions in creating source rocks (Redmile, 2021). Latitude and water depth control the amount of sunlight available to drive photosynthesis, upwelling and distance from coastline control the amount of nutrients available, all together these factors influence net primary productivity that determines the total amount of biomass available to make a source rock. The fraction of the biomass that can be preserved depends on the time it takes to reach the seafloor, the oxygen status of the water column, and the rate at which sediment buries the organic material. The final richness of the source rock is a product of the destruction and dilution of the organic matter during burial and sequestration.
Value of Palaeoenvironment Mapping
In the case of both source and reservoir, reasonable inferences about the potential presence and quality can be made by systematic and logical evaluation of the processes that make the geologic material, and the effect on those processes of the environment in which they take place. We can compare the outcome in places where source and reservoir are easy to observe to calibrate our expectation for the outcome on the frontier where observations are hard to come by.
Documentation of the environmental conditions in palaeoenvironmental maps is the best way to start.
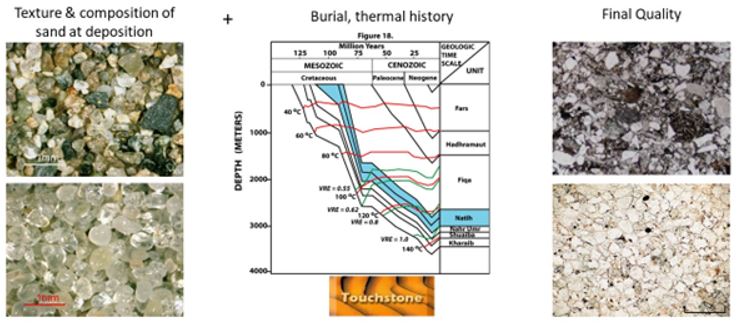
Figure 9 – Conceptual workflow for reservoir-quality forward modeling
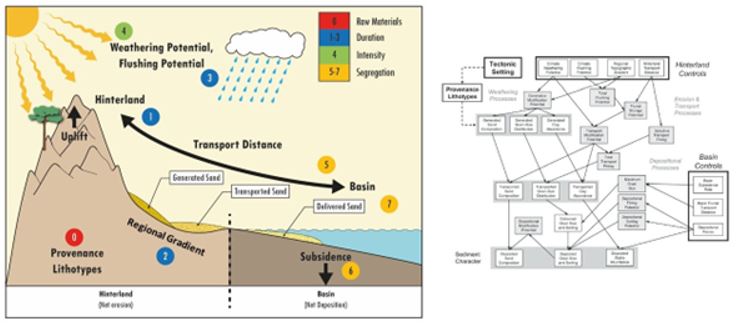
Figure 10 – Predicting texture and composition of sand at deposition from palaeoenvironmental conditions (After Heins & Kairo, 2007)
Posted by William A. Heins, Chief Geoscientist, Getech Group plc


