


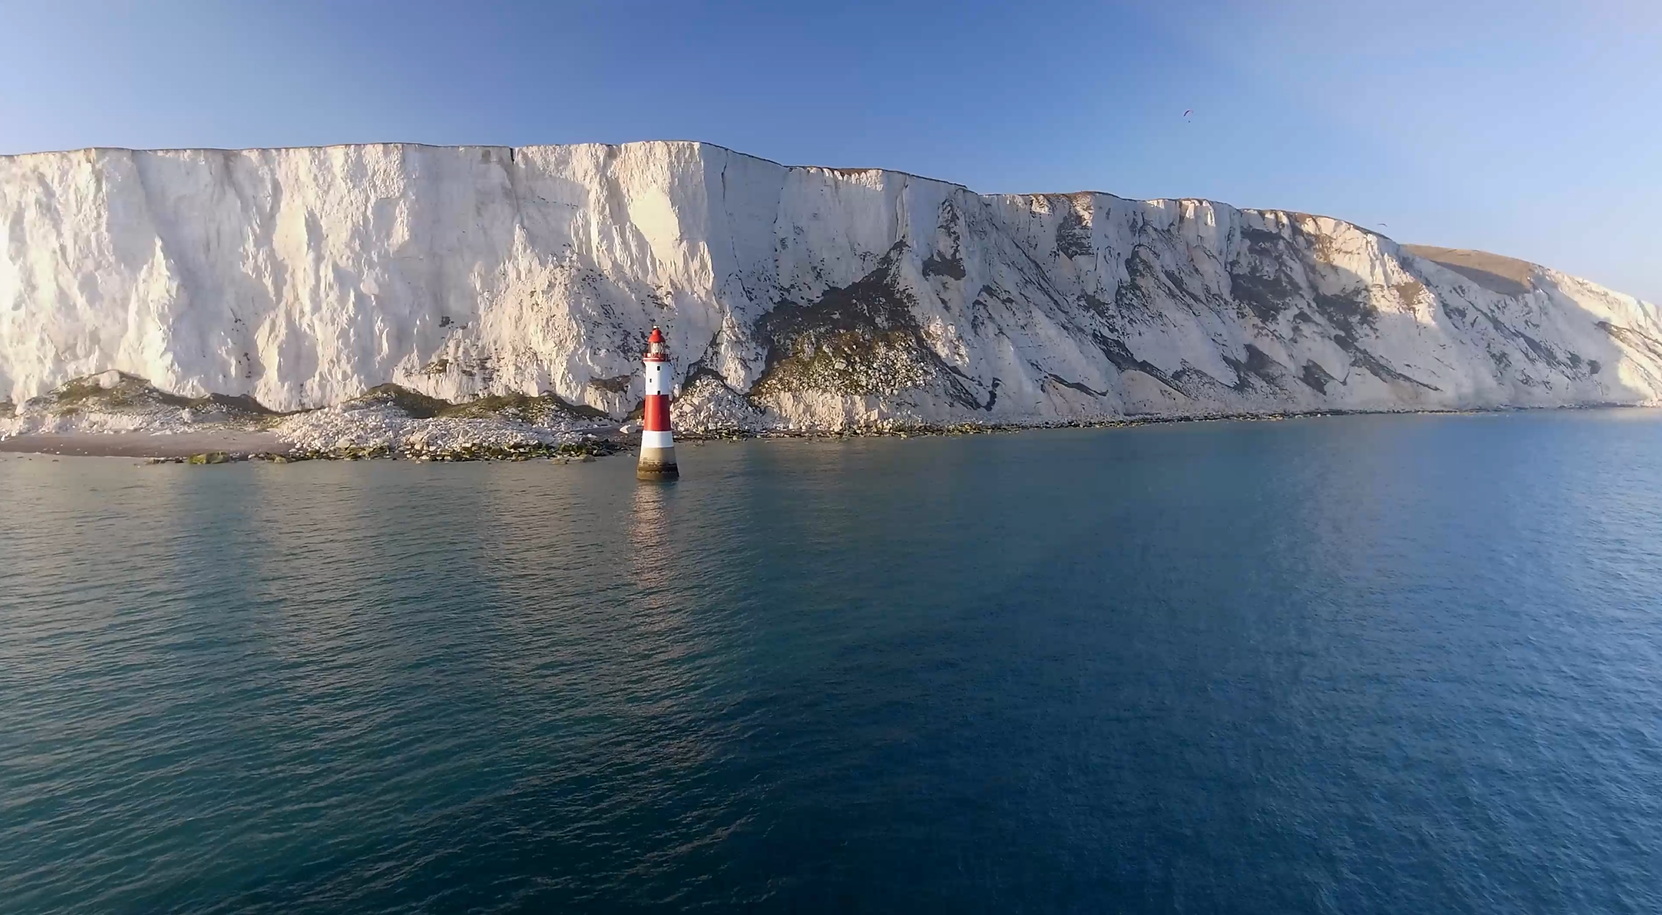
Image: CloudVisual via iStock/Getty Images
Our changing climate is already affecting us all. Eighteen of the warmest years on record have occurred during the last twenty years. Today’s average temperatures are 1°C higher than they were in the 1960s.
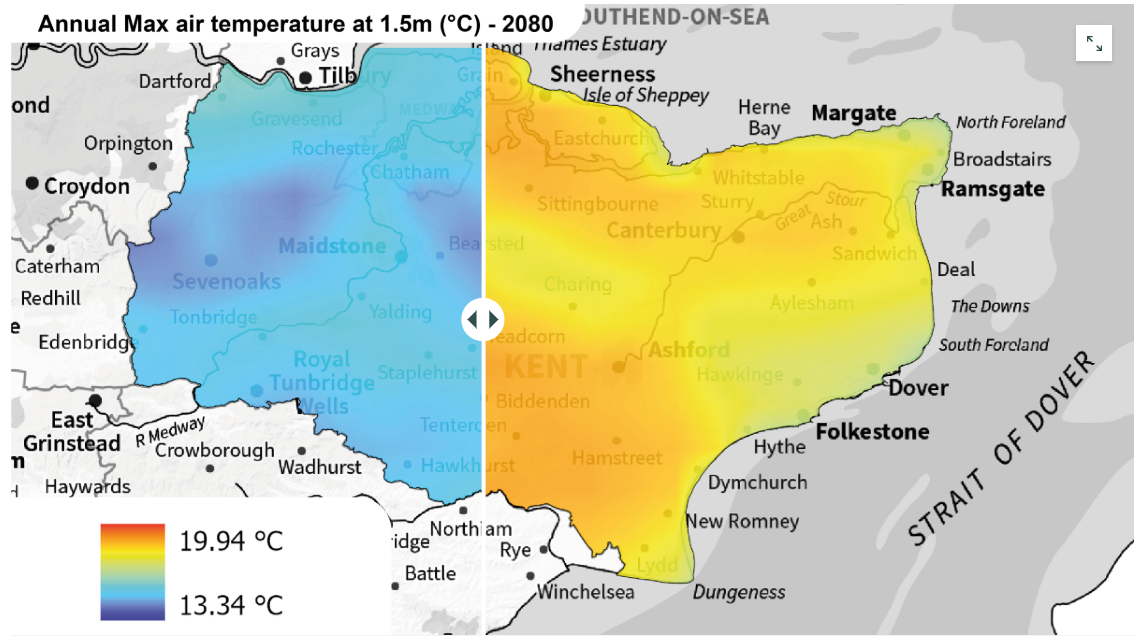
Kent County Council commissioned Exprodat to produce a series of map-based data visualisations to show how climate change will affect the county over the coming decades.
We have built a story map to share some of the maps and animations that Exprodat, a Getech Group Company, produced using ArcGIS and climate data from the UK Meteorological Office.
In this story map you will discover:
- How temperatures will rise, and rainfall patterns change, across Kent between now and 2080 – resulting in increased risk of winter floods and summer draughts.
- What is being done to defend against extreme weather events and sea level rise.
- Interactive maps and animations to understand the complex patterns of climate change in space and time.
For more information, contact us at info@getech.com.


