Many organizations are interested in the ‘Digital Twin’ – a computer-based replica of a physical asset onto which other data can be layered to derive insight: from understanding the asset’s current status to modelling potential changes. The scale of the asset being modelled can vary – in this project we’re looking at individual buildings, but the concept can be extended to the scale of a city and beyond – the live traffic data layered upon the digital road networks we use for planning journeys is an example of a continent-wide digital twin.
The sorts of questions that could be asked of a digital twin include:
- What’s the temperature or air quality in that room? Is it within the normal range?
- What’s the net value of all the art in that building? Who was that painting bought from?
- What might happen to traffic flow if we built a bridge there?
The ArcGIS Platform supports the creation and use of digital twins in the desktop and web environments (this Esri UK StoryMap nicely illustrates some of these capabilities), both as generic spatial data but also with targeted products such as ArcGIS Indoors.
In order to experiment with the technology, we decided to create digital twins of our UK offices to see what was possible. In this introductory blog we provide an overview of the project and links to subsequent blogs on the collection, processing, visualization and analysis of the data.
There will be some reinvention of the wheel in the project, as we will try to do as much of the work as we can within the ArcGIS Platform, but hopefully we will prove that it’s possible to do much of this work in that environment.
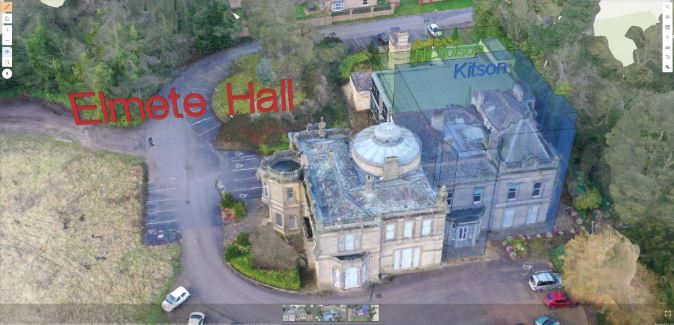
Figure 1 – Drone model with overlays highlighting Getech offices, in the ArcGIS Online Scene Viewer
Getting started
A logical starting point for a digital twin of a building is to start with its floorplan. You may be lucky and already have your floorplan in 3D CAD or BIM files, in which case you can skip on. We could only source PDF scans of our office floorplans, but these were more than adequate for creating a basic digital twin app for mapping air quality in our London office, as shown below.
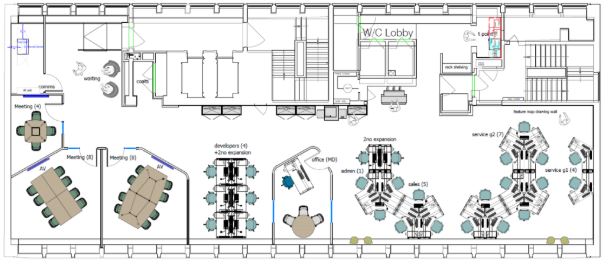
Figure 2 – Floorplan from PDF
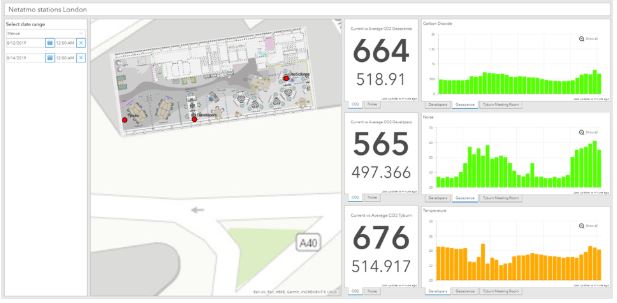
Figure 3 – Geolocated floorplan used as spatial reference for Netatmo air quality monitoring stations, within an ArcGIS Dashboards application.
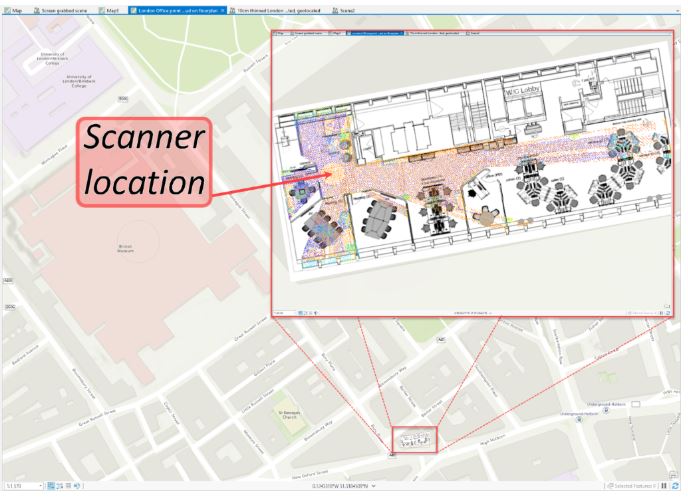
Figure 4 – A sneak peek of one of the London office laser scans, overlain on a geolocated version of the PDF’ed floorplan.
Our Leeds office is part of the Victorian Grade II listed Elmete Hall, and has, as noted in the listing entry, ‘much fine detailing’, including wood panelling, moulded plaster ceilings and external projecting carved portrait heads (see below). It also has extensive cellars and attics, and surrounding grounds – it’s not a simple box like a modern office space might be.
Including this detail within our digital twin seemed like a worthwhile challenge, to investigate and demonstrate how architectural detail might be captured for insurance and conservation purposes. Our London office, on the other hand, is a recently refurbished open-plan office and hence provides a nicely contrasting example.
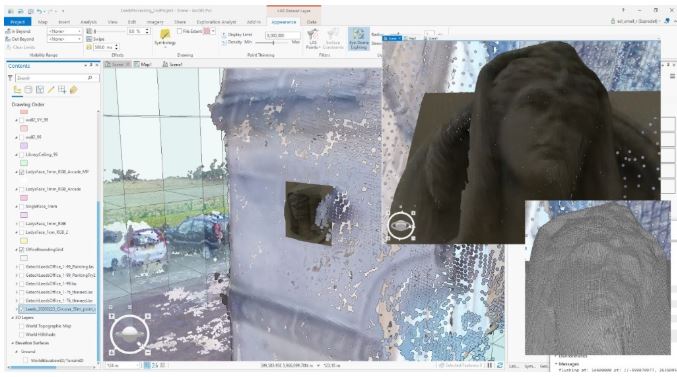
Figure 5 – Modelling of one of the external projecting carved portrait heads within ArcGIS Pro.
With our goal defined as the creation of geolocated 3D digital twins, retaining as much architectural detail as possible, we set about performing laser scan and drone surveys of our offices (if you’re interested, here’s some further background on using laser scanning to create BIM models).
After some initial planning, a small team spent a couple of days at the end of February 2020 performing laser scans (internal and external) and flying several drone survey variants of our Leeds office. Part of the team then spent a couple of hours doing an internal laser scan survey of our London office, while the rest of the team busied themselves processing the enormous amount of data we had acquired.
How did we do?
That’s it for the project introduction – check out the next blogs in this series to find out how we got on:
- Drone survey – planning, execution and data processing
- Laser scan surveys – planning, execution and initial data processing
Posted by Ross Smail, Head of Innovation.

