Knowledge of the temperature through the Earth’s crust and upper mantle is vitally important for understanding the potential for energy resources. This can be for mapping purposes, such as identifying sedimentary basins or geothermal resources, or for quantitative assessment including basin modelling and maturation history.
Direct measurements of crustal heat flow can only be performed at relatively shallow depths via borehole or probe measurements. However, when rocks are heated above the Curie temperature (c. 580 °C for magnetite, the most significant crustal magnetic mineral), they lose any magnetisation they may have had, and become non-magnetic. So, to understand temperature and heat flow at deeper depths we need to analyse properties of the Earth’s magnetic field. Getech’s workflow for modelling temperature at depth maps the Curie Temperature Depth (CTD) from three types of data; terrestrial magnetic data (collected at ground level, or from airborne or shipborne surveys), satellite magnetic data and surface heat flow measurements (Figure 1). The various datasets have differing resolutions and coverage, and the advantage of using all three is that a map of CTD with global coverage, using the best resolution data available can be created. This can then be used alongside an Earth model of thermal conductivity and radiogenic heat production to generate temperature maps at any depth.
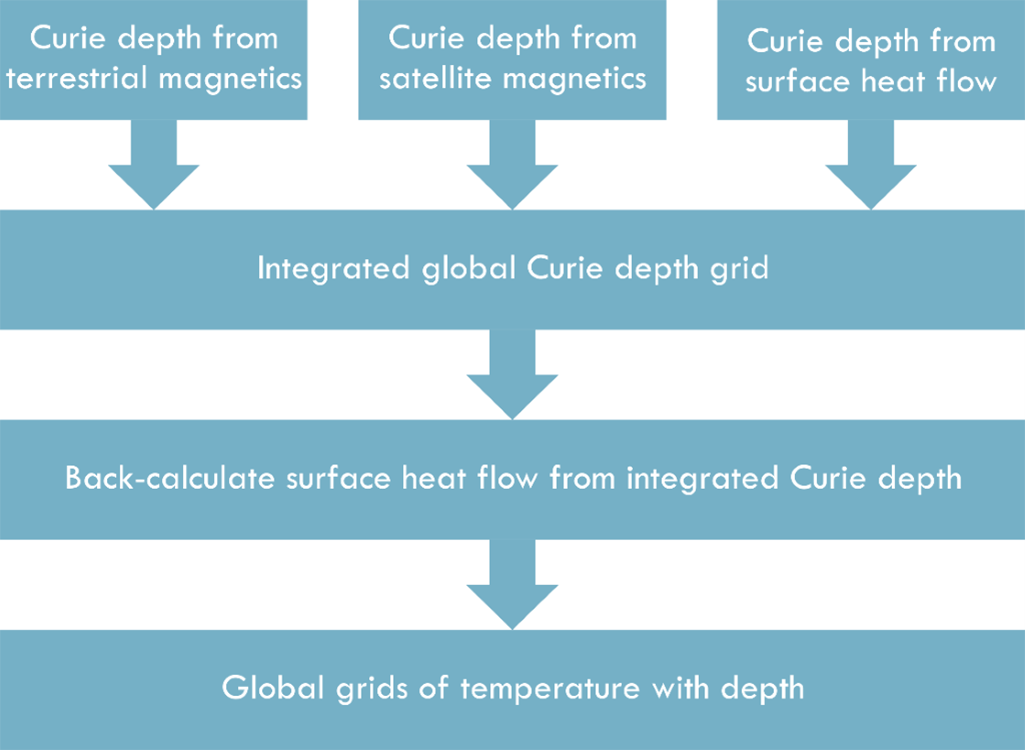
Figure 1 – Our workflow for calculating temperature-at-depth from three different data types.
Terrestrial magnetic data
Spectral methods have long been used for interpreting magnetic data, e.g. Spector and Grant (1970) and Tanaka et al. (1999). Windows of high-resolution magnetic data can be analysed in the Fourier domain and estimates made of the depth to the top and bottom of the magnetic layer made. Where the CTD is situated within magnetic material the base of the magnetic layer will be at the CTD. These methods traditionally assumed that the crustal magnetisation had a random distribution (Figure 2 – black line). Most crustal magnetisation, however, can be considered fractal (Figure 2 – coloured lines). It is therefore important that an estimate of the Fractal Index is made, and the spectrum adjusted prior to interpretation, otherwise the calculated depths will not be representative of the true crustal structure.
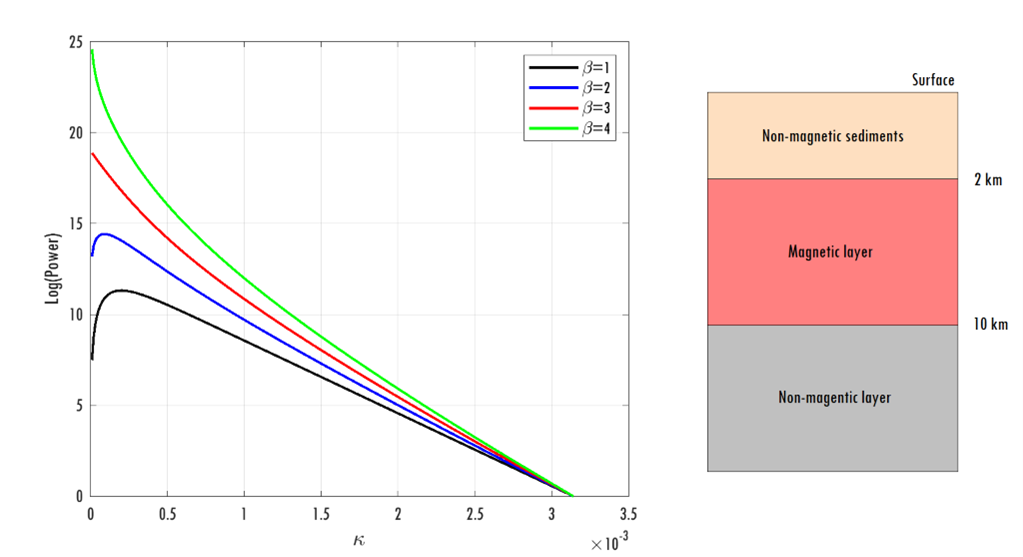
Figure 2 – Interpretation of the depth-to-basement and CTD are dependent on the fractal nature of the magnetisation of the crust (β). For reliable depth estimates to be made, this needs to be understood.
We have identified correlations between the Crustal Architecture available in our Globe product and the Fractal Index. For each crustal type we tested a range of Fractal Indices to determine the optimum Fractal Index for each crustal type. This map of Fractal Index is essential for reliable estimation of CTD.
Satellite magnetic data
As terrestrial magnetic data are mostly collected as a series of surveys with often limited spatial footprints, the coverage and resolution vary significantly. An alternative is to use satellite magnetic data, which have full global coverage and a consistent resolution. The key disadvantage to using satellite magnetic data is that the data are collected at an altitude of 300 km or more. This means that is not possible to isolate independent signals representing the top and bottom of the magnetic layer, as they are relatively close together compared with the satellite altitude.
Instead we look at variation in the amplitude of the crustal magnetic signal and interpret this as variations in the thickness of the magnetic layer. It is vital to correct for the effects of latitude and induced vs. remanent magnetisation. Once these corrections are made, the amplitude can be converted to thickness using measured estimates for the lateral magnetisation of the crust. The thickness of the magnetic layer can be converted to CTD by the addition of our Global Depth-to-Basement product.
Surface Heat Flow
Our third approach uses surface heat flow data. Temperature and heat flow at depth can be estimated from surface heat flow measurements, along with surface temperature and estimates of thermal conductivity and radiogenic heat production (Figure 3). In general, heat within the crust flows from the upper mantle to the surface via conduction. Internal heat generation comes primarily from radioactive decay of potassium, uranium and thorium.
We have used steady-state 1D heat flow equations (e.g. Salem et al., 2014); empirical relationships between thermal conductivity and temperature (e.g. Sekiguchi, 1984) and variations in heat production with depth (e.g. Jaupart et al., 2016). These equations can be used along with Getech’s global models of sediment and crustal thicknesses, as well as the mapped crustal architecture (which is used to model lateral variations in heat production) to build isotherms that show how the temperature varies at depth throughout the Earth.
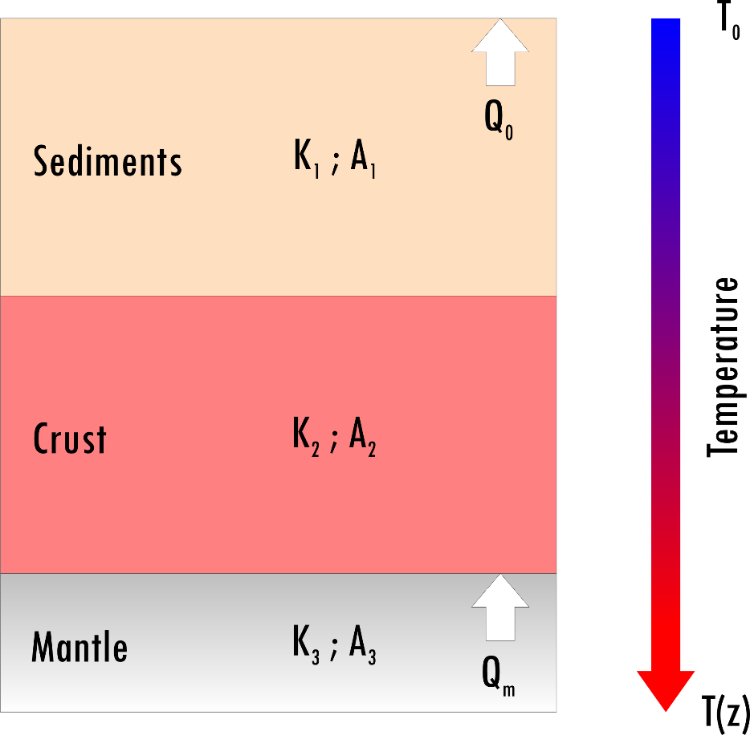
Figure 3 – Temperature through the crust is dependent upon thermal conductivity and radiogenic heat production of the various crustal layers, as well as the input heat from the mantle.
We can measure the depth at which any temperature is reached, or vice-versa – , we can map the temperature at any depth. It is useful for us to tie results from surface heat flow data to the magnetic–derived CTD estimates, so in the first case we extract a map of the depth at which the Curie Isotherm is reached.
Our CTD estimates from our three alternative approaches (terrestrial magnetics, satellite magnetics and surface heat flow) can then be combined to generate a global map of CTD, using the most reliable method in areas where CTD estimates are available for more than one of our approaches. Generally, this is considered to be the solution from surface heat flow as it is the most direct measurement of temperature, however there are geological factors that make the magnetic-derived estimates more reliable in some areas. We can also use machine learning and various global datasets that act as proxies to deep temperature indicators, to predict heat flow in data sparse areas.
Once a global map of CTD has been constructed from the three methods combined, we can use this as an input to the model to produce temperature at any depth through the crust and upper mantle. An example of this is shown in Figure 4.
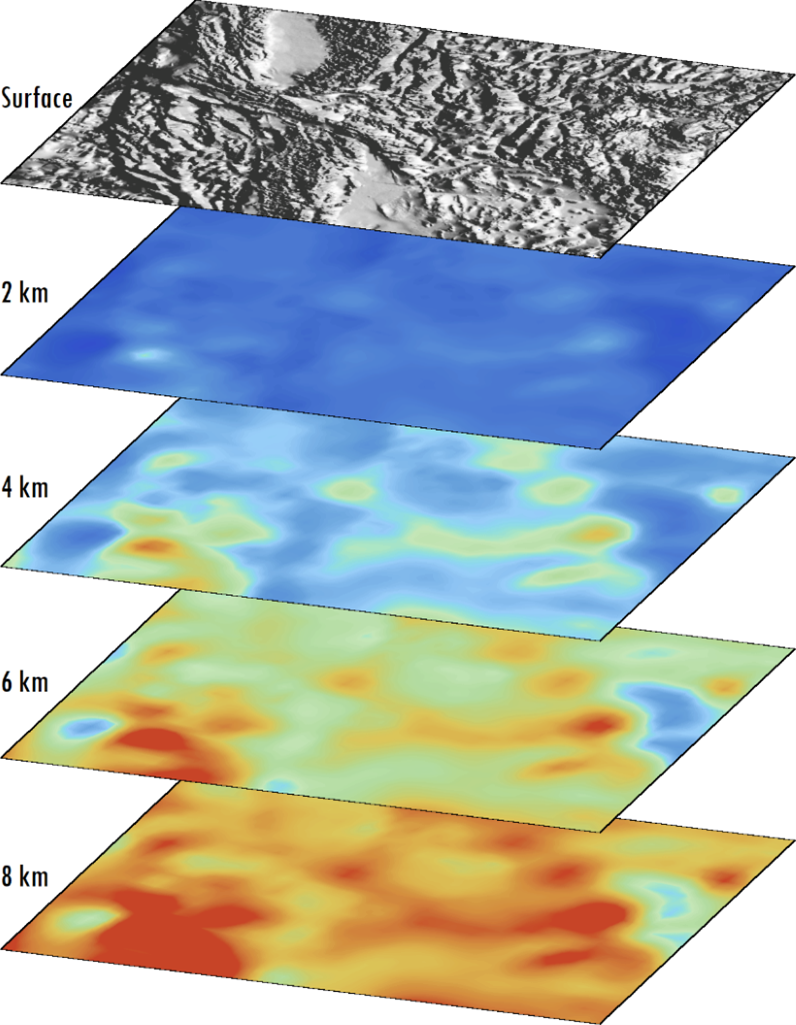
Figure 4 – Final temperature-at-depth layers, showing layers at 2, 4, 6 & 8 km below the surface. Red colours represent higher temperatures and blue colours cooler temperatures
These temperature layers can then be used for traditional hydrocarbon exploration to aid understanding of the temperature and heat flow through a sedimentary sequence, or for investigations into the geothermal potential of geographical areas throughout the world.
Contact our experts at info@getech.com to help calculate temperature at depth for your exploration projects.
Posted by Samuel Cheyney, Interpretation Geophysicist.

